Cardiac function
Velocity Time Integral VTI Measurement Handheld Ultrasound
Trace how fast blood moves through a single heartbeat, measure the area under that speed curve, and you have a distance: the length of the slug of blood that left the heart in one beat. That is the velocity time integral. Multiply it by the area of the channel the blood passed through and it becomes the stroke volume, the basis of a bedside cardiac output. The integral does the real work, since it follows the heart’s output beat to beat, and pulling it clean on a handheld probe is a skill of its own.
Putting the sample where the flow runs clean
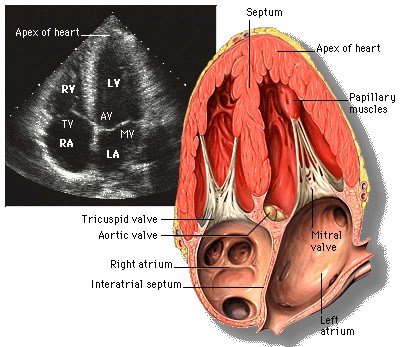
The measurement is taken in the apical five-chamber view. The heart is held point-down on the screen, the aortic valve brought into sight by a small forward tilt off the standard four-chamber. The reader places a pulsed-wave Doppler sample gate, a short window of about five to seven millimeters, into the left ventricular outflow tract just below the aortic valve. Pulsed-wave Doppler is the mode that listens at one chosen depth. That is what lets the reader pick the exact spot. It does not average the whole length of the beam the way a continuous-wave beam would. Getting the gate in the right place is the first half of a good reading. One landmark confirms the placement. A clean signal from the outflow carries a sharp little mark at end-systole, the click of the aortic valve snapping shut. Seeing that closing click tells the reader the gate sits right at the outflow, at the same level the diameter is measured for the area. The two readings that build a stroke volume then come from one matched spot. A trace with no click, or a smeared one, is a gate that has drifted into the valve or up into the ventricle. The number it returns belongs to the wrong place.
Reading a clean envelope out of a noisy one
A well-placed gate draws a clean envelope, a curve with a crisp white outer edge around a dark hollow. That shape is information. The dark centre means the blood in the outflow is nearly all moving at the same speed, the orderly flow of a healthy tract, so the velocities pile up along one bright edge a reader can follow with confidence. A filled-in, fuzzy envelope is spectral broadening. It means the flow is disturbed, or the gate is too large, or the placement is off. A broadened trace offers no single edge to trace.
The gain and the filter sharpen that edge before any tracing starts. The wall filter is set low to keep the slow signals near the baseline. The gain is dropped until only the brightest, densest part of the trace remains. That dense band is the modal velocity, the speed of the bulk of the blood cells, the line the reader follows. Gain set too high paints a bright fog above the true edge. A reader who traces the fog reads the integral too large. The discipline is to dim the picture until the envelope is a thin firm line, then trace that line and nothing above it.
Two more settings frame the envelope before it is traced. The baseline and the velocity scale are set so the curve fills the screen without running off the top, since a tall well-scaled envelope is traced more finely than a cramped one squeezed into a corner. A flow heading away from the probe sits below the baseline, so the reader shifts the baseline to give that curve room. The scale is opened until the peak sits comfortably inside it.
The sweep speed sets how wide each beat is drawn across the screen. A faster sweep stretches one beat over more pixels, which spreads the steep edges and makes them easier to follow with the cursor. A reader chasing a precise integral turns the sweep up, trading the number of beats on screen for the width of each one.
The tracing that turns a curve into a number
The tracing is the step that decides the integral, so it repays a slow hand. The reader draws around the envelope starting at the baseline, climbing the steep upstroke, crossing the peak, then dropping down the tail to the baseline again. The shape enclosed is the area, which the machine reads as the stroke distance in centimeters. The steep early and late parts of the curve are the hard ones. A small wobble of the cursor on a near-vertical edge moves the enclosed area a surprising amount, far more than the same wobble across the rounded peak. This is the reason the integral is harder to reproduce than a simple peak velocity, which needs only one point picked at the top. Two readers, or one reader measuring twice, can land several percent apart on the same beat for no reason beyond where their cursors caught those steep edges. The defence is a fixed habit. Trace edge to edge along the modal line the same way every time, start and finish exactly on the baseline, then let the machine do the integrating. Many handheld systems offer an automatic trace that finds the envelope on its own, which removes some of the hand-to-hand scatter, though it follows a fog the same way a careless reader would if the gain was left too high. The automatic line is checked against the picture, never trusted blind. A clean manual trace on a well-set envelope still beats an automatic trace on a poor one. The number that comes out is only as honest as the envelope it was drawn around, which is why the minutes spent on the gate, the gain, and the filter pay back here, at the tracing, where a clean line is quick and a dirty one is guesswork. A reader who rushes the setup pays for it with a number that changes every time the cursor moves. The fix for a shaky reading is almost never a steadier hand on the trace. It is a better envelope to trace, found by going back to the gate and the gain. The cursor only copies what the envelope already shows. A clean envelope nearly traces itself. A fuzzy one defeats the steadiest hand. The order of work follows from that: gate, then gain and filter, then baseline and sweep, then the trace last of all, each step earning the one after it.
Setup is the work. The trace is just the record of it.
Why the integral beats a single velocity
A reader could measure only the tallest point of the envelope, the peak velocity, and avoid the tracing altogether. The integral is the better measure for a plain reason. Peak velocity is one instant, the fastest the blood ever moved through the beat. The integral sums the whole stroke, the slow start and the long tail together, so it reflects the volume that passed through. The peak marks only the fastest instant of it. A heart that ejects fast and short posts a tall peak. The integral behind it can still be small. The integral is the one that tracks the stroke volume.
That fidelity has won the outflow integral a role of its own in following sick hearts. In advanced heart failure the outflow integral has been shown to track outcome more closely than the ejection fraction, and more closely than the full cardiac output calculation built on it, since it captures forward flow directly without the geometric guesses those other figures carry. A low integral, well under the high-teens to low-twenties centimeters a healthy outflow gives, is a blunt honest signal that the heart moves little blood with each beat, whatever its ejection fraction reads.
The same measurement reads the same physics at other valves when the outflow is hard to reach. A gate in the right ventricular outflow tract gives a right-sided stroke distance. A trace at the mitral inflow tells a different story, one about how the heart fills. The outflow integral stays the workhorse, since it sits at the door the whole stroke volume leaves through.
Half a stroke volume on its own
The integral is only half a stroke volume. It needs the outflow area, measured in another view, to become a volume in milliliters.
What a single integral cannot settle
The integral is one number from one beat, so an irregular rhythm makes it wander. Atrial fibrillation changes the filling from beat to beat, dragging the stroke distance with it, so a reader averages the integral over several beats before trusting it in a fibrillating patient. The averaging follows a rule of thumb, around five beats in a mildly irregular rhythm and ten in a chaotic one, enough that the high and low strokes balance into a figure that stands for the patient across the irregular beats. A single beat in that rhythm is a snapshot of a moving target.
The angle between the beam and the flow sets a ceiling on the whole reading. Doppler reports only the part of the velocity aimed along the beam, so a beam that crosses the outflow at a slant reads every velocity low, and the integral with them. The apical five-chamber view is chosen because it lines the beam up nearly along the outflow. A reader who cannot raise that alignment cannot trust the figure, no matter how carefully the envelope is then traced. A poorly aligned trace stays wrong however carefully it is drawn around.
The integral does its real work as a number to watch, not a number to frame. Its absolute value carries the angle error and the tracing scatter, so a reader leans on how it moves: the rise on a leg raise or a fluid challenge, the fall as a heart tires, the trend across a shift. Multiplying the integral by the outflow area also folds in that diameter’s error the moment the two are combined. A reader who trends the raw integral alone, skipping the area, sidesteps that second error entirely, which is part of why the bare integral is the figure clinicians watch in a resuscitation.
The measurement rewards practice at every step. The gate placement, the gain, the baseline, the trace each take a feel that builds over many hearts, so a reader new to it posts wider scatter than a seasoned one on the same patient. A pocket probe puts the tool in more hands than a cart ever did, which makes that learning curve a thing a service plans for at the outset.
Read carefully, traced cleanly off a clicked, well-placed gate on a dimmed envelope, the velocity time integral is among the more informative things a pocket probe pulls from a beating heart. It is the bridge between a grey moving picture and a number a clinician can carry to the bedside decision.
Common questions about the velocity time integral
What is the velocity time integral?
It is the distance a column of blood travels in one heartbeat, the area under a Doppler speed curve, read in centimeters. Multiplied by the outflow area it gives the stroke volume.
Where is the Doppler sample gate placed?
A pulsed-wave gate of about five to seven millimeters sits in the left ventricular outflow tract just below the aortic valve, in the apical five-chamber view. A sharp closing click confirms the gate sits at the outflow.
How do you read a clean envelope?
Set the wall filter low, drop the gain until only the dense modal line remains, scale the curve to fill the screen, and turn up the sweep speed. A clean envelope has a crisp outer edge around a dark hollow.
Why is the trace hard to reproduce?
A small wobble of the cursor on the steep upstroke or downstroke moves the enclosed area a lot. Tracing the modal line the same way every time, starting and finishing on the baseline, keeps two readings close.
How does the integral compare with peak velocity?
Peak velocity is one instant, the fastest the blood moved. The integral sums the whole stroke, so it tracks the volume that passed. A fast brief ejection can post a tall peak with a small integral.
What about an irregular rhythm?
Atrial fibrillation changes the stroke beat to beat, so the integral is averaged over several beats, around five in a mild irregularity and ten in a chaotic one, before it is trusted.

About the Author
Julien Mercier
Senior R&D Engineer · Medical Ultrasound Transducer Development
Senior R&D Engineer with an M.S. in Applied Physics and over 15 years of experience in medical ultrasound transducer development, specializing in the design verification and performance testing of high-frequency imaging transducers. Currently leading the development and verification of the company’s next-generation high-frequency linear-array transducer, responsible for imaging performance evaluation and reliability analysis in preclinical testing. Brings extensive hands-on experience in piezoelectric element tuning, beamforming parameter optimization, and system-level performance testing.