Spectral Doppler
Pulsed Wave PW Doppler Operation in Handheld Ultrasound

Pulsed wave Doppler reads the speed of blood at one chosen point and plots it against time. Where colour paints flow across a whole box, the pulsed wave mode places a small gate on a single vessel at a single depth and draws the speed there as a waveform, the trace that rises and falls under the screen. That waveform is what a velocity is measured from, the peak speed of a jet or the shape of a pulse, the numbers a vascular or a cardiac study is built on. The operation is three steps: placing the gate, correcting for the angle, and reading the trace the machine returns.
How the pulsed wave mode reads one depth
The mode sends a short pulse and listens for its echo at a set delay, the delay that matches the depth of the gate. A target deeper down returns its echo later, so the machine opens its ear only at the moment an echo from the chosen depth arrives, ignoring everything above and below. By sending pulse after pulse and watching how the echo’s frequency shifts from one to the next, it reads the speed of whatever moves at that depth. This is what lets the mode read a single vessel where colour reads a whole field, and it is why the gate sits at a depth the operator sets by hand. The reading is tied to that one point, and the machine reports its speed alone. The cost of sampling pulse by pulse is a ceiling on the speed the mode can read without error. A flow faster than half the rate at which pulses are sent, the Nyquist limit, folds over on the trace and reads as flow in the wrong direction, the aliasing that breaks a tall waveform and wraps its top to the bottom of the screen. The pulse rate climbs as the gate moves shallower and falls as it moves deeper, since a deep gate has to wait longer for each echo, so a deep fast jet reaches that ceiling sooner than a shallow one. There is a reason the depth and the pulse rate are tied. Each pulse has to return before the next goes out, or the machine cannot tell which pulse an echo belongs to, so the deepest a clean gate can sit is fixed by how fast the pulses are sent. The gate’s depth, the pulse rate, and the top speed the trace can hold without folding over are three faces of one constraint: lift the rate to read a faster flow and the deepest unambiguous gate moves shallower, drop it to reach a deeper vessel and the speed ceiling comes down. The small region the gate reads, the sample volume, is set in the same act, its length along the beam following the pulse the machine sends and its width following the beam itself. The whole skill of the mode lives inside this trade between depth and the speed it can read clean, and the controls exist to wring the clearest trace the body’s own geometry allows. The depth of that one gate is the first choice the operator makes, and every later setting answers to it.
Placing the sample gate
The gate is dropped onto the vessel from the colour or the greyscale picture first. A vessel is found and centred, the gate marker moved onto the middle of its lumen at the depth where the flow runs cleanest, clear of the wall where the stream slows and tumbles. The depth of the gate is read off the same scale the image uses, so the speed that comes back belongs to a known point in the body.
The size of the gate is set to the vessel. A gate a millimetre or two wide sits inside a small vessel and reads the flow at its centre, while a wider gate spans more of the lumen and gathers a fuller picture of the range of speeds across it. A gate left too large picks up the slow flow near the wall and muddies the trace, so it is narrowed to the part of the stream the question is about.
Correcting for the beam angle
The speed the mode reads depends on the angle between the beam and the flow, since a Doppler shift carries only the part of the motion that runs along the beam. A beam square across a vessel reads almost no shift and returns a speed far below the truth, while a beam swung toward the line of flow reads closer to it. The operator lays an angle-correction cursor along the vessel so the machine knows the true direction of flow and scales the reading up to match.
The correction has a working limit. Past about sixty degrees between beam and flow, a small error in the cursor angle throws a large error into the speed, since the maths divides by a number that shrinks fast near ninety degrees. The operator keeps the angle under sixty by tilting the probe or steering the beam, so the speed that comes back is one the study can trust.
On a vessel that runs straight across the screen, the beam is steered to one side to open an angle to the flow, the colour box and the gate tilted together. The reading is only as good as that cursor, and an operator who lays it carelessly along the wrong line reports a speed that is wrong by a known and avoidable amount.
Reading the spectral trace

The trace is a plot of speed against time, the height of the line at any moment the speed of flow then. An artery draws a tall sharp peak with each heartbeat, the systolic upstroke, and falls to a lower level between beats, the diastolic flow, while a vein draws a low steady band that shifts gently with breathing. The shape alone shows whether a vessel’s flow runs healthy or disturbed, before any number is read.
The peak systolic velocity is the number a narrowing is graded by. Flow speeds up through a tight spot, so the peak of the trace climbs as the vessel beyond the gate narrows, a figure in centimetres per second that sorts the degree of a stenosis. The end-diastolic velocity, the speed at the bottom of the trace between beats, carries its own reading, a high diastolic flow marking a low-resistance bed downstream and a flow that drops to nothing marking a high-resistance one.
From the same trace the machine works out a set of ratios that need no angle correction, since they weigh one part of the waveform against another. The resistive index sets the peak against the end-diastolic speed, and the pulsatility index weighs the swing of the waveform against its mean, each a number that rises when the vessel downstream is stiff or blocked. These ratios read on an organ’s blood supply, a transplanted kidney or an umbilical artery, where the shape of the flow matters more than its exact speed.
The velocity-time integral comes from tracing the area under one beat of the waveform, the distance the column of blood travels in that beat. Multiplied by the area of the vessel, it gives the volume of flow per beat, the figure a cardiac output is built from. The handheld traces it with a cursor or reads it automatically, the number falling out of the same waveform the speed was read from.
Setting the controls for a clean trace
The scale, the pulse repetition frequency, is set to the flow expected. A fast arterial jet needs a high scale so its tall peak fits on the screen without aliasing, and a slow venous flow needs a low scale so its small waveform fills the trace instead of crawling along the baseline. The operator lifts or drops the scale until the waveform sits well inside the screen.
The baseline is shifted to make room. When a fast flow in one direction aliases off the top of the screen, the baseline is dragged down to give that direction more room before the wrap, a trick that buys a higher readable speed without touching the scale. A flow that runs both ways across a beat takes a baseline near the middle.
The wall filter cuts the low-frequency thump of the moving vessel wall, set high enough to clear that thump from the trace and low enough to keep the slow diastolic flow that carries a finding. The gain is raised until the waveform is bright and clear against a dark background, then dropped just below the point where noise fills the screen behind it. The sweep speed, how fast the trace scrolls across the screen, is set so a few clean beats sit in view at once.
A deep fast jet that aliases even at the top scale takes a different mode. The machine switches to a high pulse repetition setting that sends a second pulse before the first returns, lifting the speed ceiling at the cost of a second gate appearing on the screen, or it drops to continuous wave Doppler, which reads any speed without aliasing but loses the single-depth gate. The operator picks the tool the jet’s speed and depth call for.
The display is read with a few more touches. The trace can be inverted so that flow toward the probe sits above the baseline whichever way the vessel happens to run, keeping a familiar shape on the screen for the reader. The velocity scale down the side reads in centimetres or metres per second, and the machine marks the peak and the trough on a frozen trace, dropping the figures into the report once the waveform is held still.
The trace is a number, not a picture
Colour shows where flow is. The pulsed wave trace says how fast, in figures a report carries.
Where the mode does its work in a handheld study
A cardiac study leans on the trace for the speed across a valve, the figure that grades a leak or a tight opening, and for the flow through the outflow tract that a cardiac output is built from. In vascular work the same trace reads the peak speed through a carotid narrowing and the waveform shape along a leg artery, turning a grey picture of a vessel into a graded finding. Obstetric scanning takes it to the umbilical and the uterine arteries, where the waveform ratios mark a placenta under strain and a fetus that may be going short of the flow it needs to grow.
The handheld carries the mode as a step in the same scan. A vessel is found in greyscale, mapped in colour, then measured in pulsed wave, the gate dropped and the trace read without changing probes or leaving the bedside. The number that once meant a trip to a cart-based machine now comes off a pocket probe in the same minutes the rest of the scan takes, the waveform drawn on the screen and frozen for the record in one hand.
The reading rewards a careful hand. The gate placed in the cleanest part of the stream, the angle kept under sixty and the cursor laid true, the scale and baseline set so the waveform sits clean on the screen, each step feeds the accuracy of the number that comes out, and a trace read off a careless setup carries an error no report should rest on. The mode returns a number worth exactly the care that went into the gate, the angle, and the scale behind it.
Common questions about pulsed wave Doppler
What is pulsed wave Doppler used for?
Reading the speed of blood at one chosen depth and plotting it as a waveform against time. It measures a peak velocity through a narrowing, the flow across a heart valve, and the waveform ratios that grade an organ’s blood supply.
What is the difference between pulsed wave and continuous wave Doppler?
Pulsed wave reads the speed at a single gated depth but cannot read a very fast flow without aliasing. Continuous wave reads any speed without aliasing but loses the single depth, sampling all the flow along the beam at once. A fast deep jet is read on continuous wave; a depth-specific reading is taken on pulsed wave.
Why does the trace alias?
The mode samples flow pulse by pulse, and a flow faster than half the pulse rate, the Nyquist limit, folds over on the trace and reads in the wrong direction. Raising the scale, shifting the baseline, or switching to a high pulse repetition mode pushes that ceiling up.
Why does the angle matter?
A Doppler shift carries only the part of the flow that runs along the beam, so the angle-correction cursor must be laid along the vessel for a true speed. Past sixty degrees a small angle error throws a large speed error, so the operator keeps the angle under sixty.
How is the sample gate set?
It is placed on the middle of the vessel’s lumen at the depth where the flow runs cleanest, clear of the wall, and sized to the vessel, a millimetre or two for a small vessel and wider to span more of the lumen.
Can a handheld probe do pulsed wave Doppler?
Yes. A handheld carries it as a step in the same scan, the vessel found in greyscale, mapped in colour, then gated and measured in pulsed wave, the waveform drawn on the screen without changing probes or leaving the bedside.
About the Author
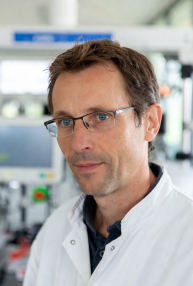
Julien Mercier
Senior R&D Engineer · Medical Ultrasound Transducer Development
Senior R&D Engineer with an M.S. in Applied Physics and over 15 years of experience in medical ultrasound transducer development, specializing in the design verification and performance testing of high-frequency imaging transducers. Currently leading the development and verification of the company’s next-generation high-frequency linear-array transducer, responsible for imaging performance evaluation and reliability analysis in preclinical testing. Brings extensive hands-on experience in piezoelectric element tuning, beamforming parameter optimization, and system-level performance testing.