











Mitral Regurgitation Continuous Wave Doppler Handheld Assessment
Continuous wave Doppler sizes a mitral leak by the jet it throws back into the left atrium. A faulty valve lets blood run the wrong way in systole. The Doppler reads the speed, the density, and the shape of that backward jet. A handheld scanner carries the read to the bedside, where a clinician finds the murmur, lays the colour box on the valve, and grades the leak.
What mitral regurgitation is
Mitral regurgitation is a backward leak through the valve between the left atrium and the left ventricle. The valve should close tight in systole. A leak lets blood run back into the atrium with each beat. The left ventricle then pumps the same blood twice, forward and back. The extra load falls on a ventricle already doing its work. The valve has two leaflets and a ring, with cords tethering it to the muscle below. A fault anywhere along that apparatus can let it leak. The leak can creep on over years or arrive in a day. A clinician grades how much blood runs back and how well the heart bears it. The two leaflets, anterior and posterior, hang from a ring and anchor to two papillary muscles by fine cords. A clinician reads the leak as a fault of the whole apparatus, from the ring to the cords.
A leak begins in the valve itself or in the ventricle that holds it. A worn or prolapsing leaflet fails to seal, the common cause in a degenerative valve. A torn cord drops a leaflet into the atrium, a flail that leaks hard. A stretched or scarred ventricle pulls the leaflets apart, so a structurally sound valve leaks all the same. An infection can eat a hole in a leaflet within days. A clinician notes the cause, since it steers the repair. The valve apparatus gives many points to fail, from the leaflets to the cords to the ring. A prolapsing leaflet billows back past the ring in systole, the mark of a degenerative valve. A vegetation from infection can perforate a leaflet or hold it open. Rheumatic disease thickens and tethers the leaflets where it stays common. A clinician sorts the leak by leaflet motion: too much, too little, or normal.
A chronic leak builds slowly. The atrium and the ventricle stretch to take the extra volume. The chambers enlarge over the years, taking the load at a low pressure. A clinician sees a patient who stays well for a long time. The roomy atrium hides a large leak behind a quiet pressure. The ventricle does extra work each beat, pumping the leaked blood again. The strain builds over time. The muscle begins to tire. A clinician watches for the first drop in the ventricle’s function, since it can fall before symptoms show. The heart can carry a large chronic leak for years before the first complaint. The ventricle grows long to hold the load, an eccentric remodelling. The stretched atrium sets the stage for atrial fibrillation. The pressure climbs into the lungs only late, once the chambers can stretch no further. A clinician reads the chamber sizes as a record of how long the leak has run.
The symptoms come from blood backing up and output falling. Breathlessness on effort comes first, from the backed-up pressure in the lungs. Fatigue follows a forward output that runs low. An irregular pulse can mark the atrial fibrillation a stretched atrium breeds. The murmur is a blowing sound through all of systole, heard at the apex and carrying into the axilla. A louder murmur through all of systole tends to mark a larger leak. A clinician hears it and reaches for the Doppler to size the leak. The bedside read turns a heard murmur into a measured leak. The murmur can soften or vanish in an acute leak, even as the patient sinks. A clinician trusts the murmur loosely, since it tracks the leak only in part. An apex that heaves and shifts points to a ventricle long burdened. A third heart sound can mark the large volume crossing the valve in early filling.
The leak shows itself on the Doppler as a jet flying back into the atrium. Colour flow paints the jet. Continuous wave reads its speed and its strength. A handheld runs both on the one probe at the bedside. A clinician finds the murmur, lays the colour box on the valve, and sees the leak at once. A clinician grades the leak from the jet and plans the follow-up from the grade. The bedside study spares a wait for the lab in a sick patient. A clinician reads the leak in steps, from a quick colour look to a measured orifice. The handheld covers the screen and the early grade at the chair. A deeper study with a probe down the gullet maps the exact fault before a repair. A clinician sends the complex valve on for that closer look.
Reading the regurgitant jet with continuous wave
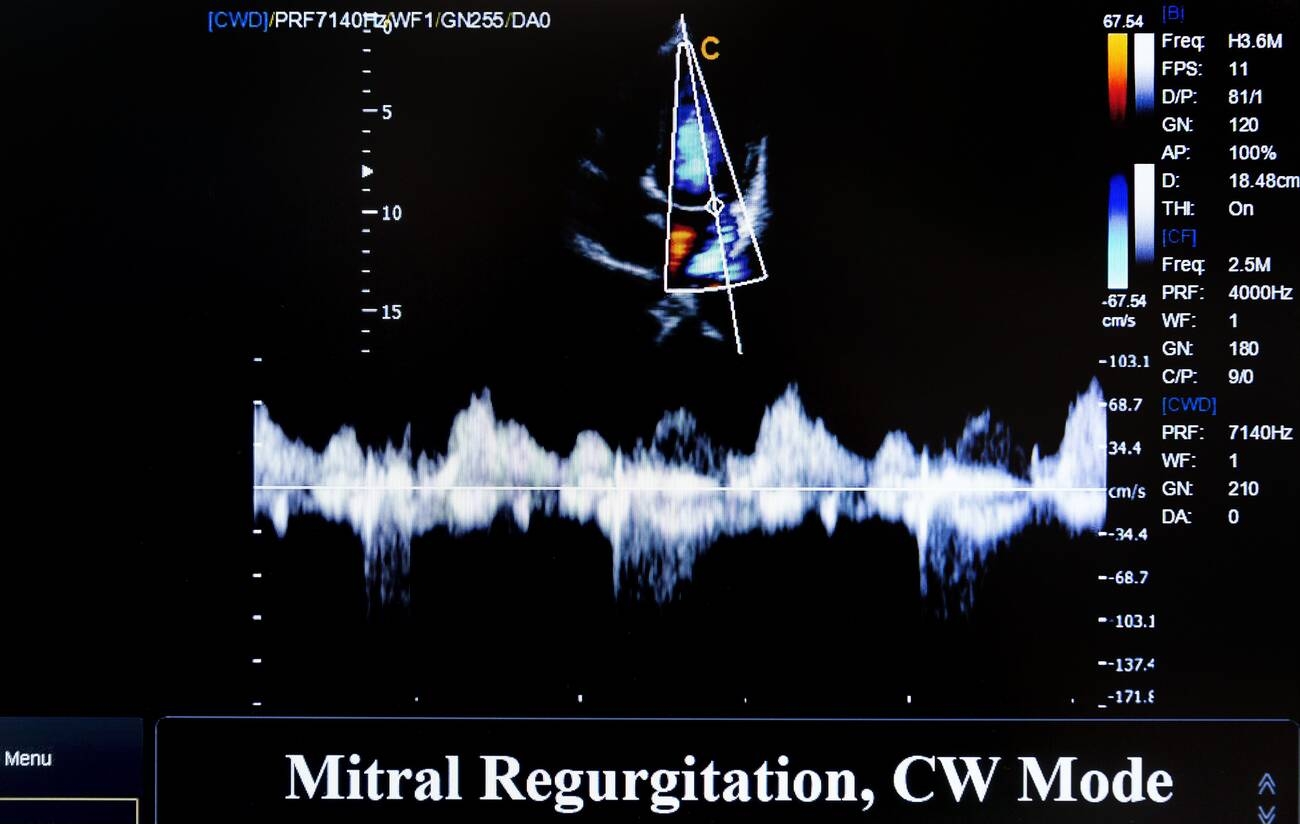
A clinician finds the jet on colour flow first. The colour box over the valve lights up the leak as a mosaic spray into the atrium in systole. The jet marks where the leak runs. A clinician lays the continuous wave beam down that jet for its speed. The apical window lines the beam up with a jet that flies toward the probe. A clinician reads the trace above the baseline there. The continuous beam reads the fastest flow on the line, which catches the high-speed leak whole. A clinician swings the probe to find the densest signal. The apical four-chamber and the long-axis windows both open the leak to the beam. A clinician sets the colour Nyquist high enough to show the jet clean. The trace from the best-aligned window gives the truest read of the leak. A clinician marks that window for the next study.
The mitral leak runs fast, driven by the high pressure of the ventricle relative to the low pressure of the atrium. The jet can pass five metres a second. Continuous wave reads that speed with no ceiling to cap it. The speed itself does not grade the leak, since even a tiny leak can run fast. A clinician judges the density and the shape of the signal for the size of the leak. The look of the trace says more about the leak than its peak does. A clinician reads the signal as a whole, the brightness, the contour, and the timing at once. The brightness and the contour weigh heaviest for the size of the leak.
What the CW signal shows
The density of the signal tracks the size of the leak. The denser the trace, the more red cells the leak throws back each beat. A leak whose signal rivals the forward flow in brightness throws back a large volume. A clinician weighs the density against that forward flow on the same trace. A faint signal points to a trivial leak. A clinician sets the gain to a fair level, since too much gain fakes a dense trace. The density gives a quick read before any measurement. A clinician compares the leak signal with the forward inflow on the same sweep. A signal near as bright as the inflow throws back a large share of the stroke. The density gives a coarse grade in a glance, ahead of any number.
The shape of the trace adds to the density. A chronic leak draws a smooth envelope that fills all of systole. The contour follows the pressure difference between the chambers. A clinician reads a full envelope as a steady chronic leak. The peak sits in mid-systole, where the pressure difference tops out. The trace runs dense through the whole beat in a large leak. A clinician times the envelope to systole to be sure it is the mitral leak. A chronic leak fills systole evenly, a neat dome from the first sound to the second. The contour stays symmetric. The chambers take the load with room to spare. A clinician reads that even fill as a settled chronic leak.
The peak speed of the jet measures the pressure gap between the ventricle and the atrium. A clinician reads it for the atrial pressure behind the leak. A high left-atrial pressure drops the peak speed, since it narrows the gap the leak crosses. A late systolic dip in the trace, a cutoff, marks a sharp rise in atrial pressure. A clinician treats that cutoff as a warning of an overloaded atrium. The shape of the late trace carries this clue beyond the size of the leak. A normal atrial pressure lets the jet reach five or six metres a second at its peak. A clinician reads the rate of the early rise for the strength of the ventricle. A brisk rise marks a strong pump behind the leak.
The mitral jet runs through all of systole, from the first heart sound to the second. A clinician times the envelope to the heart sounds to name it. A jet that fills only part of systole comes from another valve. A clinician checks the full-length mitral envelope to confirm the leak. A clinician checks that the jet flies back into the atrium behind the valve. The timing names the jet before its size is graded. A holosystolic envelope runs from the first sound to the second, the mark of a steady leak. A clinician reads the timing for the mechanism as much as the size.
Quantifying the leak
No single number grades a mitral leak. A clinician reads several measures and weighs them together. The width of the jet at its neck, the size of the flow it gathers, and the volume it throws back each add a piece. A clinician builds the grade from the measures that agree. A leak that reads severe on several measures earns the grade. A clinician takes the chamber sizes and the pulmonary vein flow as backup signs. A vein flow that reverses in systole marks a severe leak. A big atrium and a stretched ventricle back a long-standing severe leak. The cut-offs come from the ASE recommendations on valvular regurgitation, the standard a clinician grades by.
| Measure | Mild | Moderate | Severe |
|---|---|---|---|
| Vena contracta width | Under 0.3 cm | 0.3–0.69 cm | 0.7 cm and above |
| Effective orifice area | Under 0.20 cm² | 0.20–0.39 cm² | 0.40 cm² and above |
| Regurgitant volume | Under 30 mL | 30–59 mL | 60 mL and above |
| Regurgitant fraction | Under 30% | 30–49% | 50% and above |
The vena contracta is the narrowest neck of the jet, a step past the valve. A clinician measures its width on a zoomed colour image. A wide neck marks a large leak through a wide hole. The width holds up across leak types, which makes it a steady measure. A clinician reads it in the view that cuts the neck square. A clinician keeps the colour scale set so the neck stands out clean. The neck width feeds straight into the grade. A clinician measures the neck in two planes, since a single plane can clip it short. A neck at or past seven millimetres marks a severe leak on its own. Two jets need their necks weighed together for the true size.
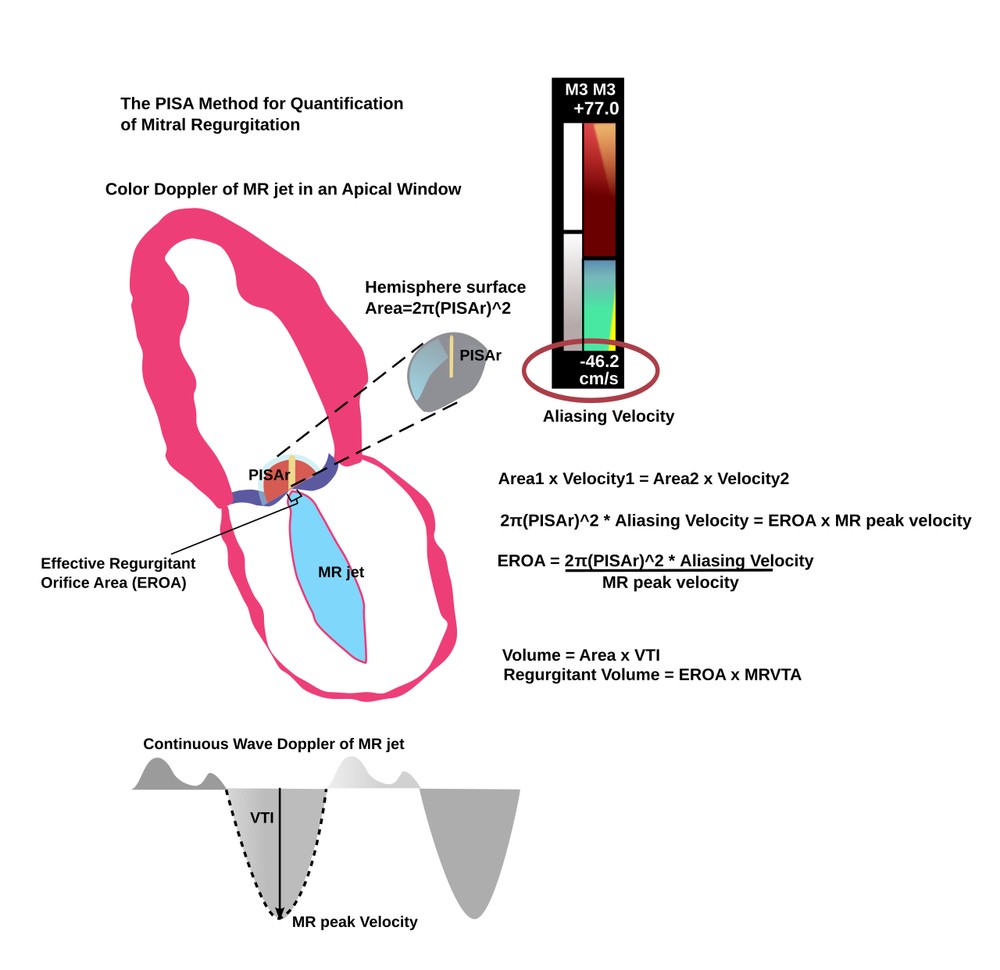
The PISA method reads the flow as it funnels into the leak. Blood speeds up into a series of domes near the hole. The colour flips at a set speed. A clinician measures the radius of that flip on the image. The radius gives the flow rate into the leak, which yields the effective orifice area. The orifice area is the size of the hole the leak crosses, the core of the grade. A clinician reads the continuous wave trace for the leak’s own speed to finish the sum. A clinician shifts the colour baseline to set the aliasing speed for a clear dome. The radius enters the flow as a sphere, so a small slip in it swings the result. An eccentric leak bends the dome out of true, which a clinician allows for.
The regurgitant volume is the blood thrown back each beat. A clinician multiplies the orifice area by the leak’s speed-time tracing from the continuous wave signal. The continuous wave trace gives that tracing, which ties the mode straight into the volume. The regurgitant fraction is the share of the stroke that leaks back. A large fraction marks a leak that wastes much of each beat. A clinician trusts a grade that the volume, the area, and the neck all support. The regurgitant volume crosses sixty millilitres in a severe leak. The fraction passes half the stroke when the leak is severe. A clinician reads the volume from the orifice and the speed, or from the difference between the two stroke volumes.
The colour jet in the atrium gives a first look at the leak. A large jet that swirls deep into the atrium suggests a large leak. A clinician weighs the jet area with care, since the settings and the chamber size sway it. An eccentric jet that hugs the atrial wall looks small for its true size. A clinician trusts the neck and the orifice area more than the raw jet area. The colour jet starts the read. The measures finish it. A clinician sets the colour gain and the Nyquist before trusting the jet area at all. A jet that fills much of a normal atrium points to a large leak. The systolic reversal in the pulmonary vein backs a severe grade better than the raw area.
The acute leak and its trap
An acute leak springs a trap for the unwary. A cord snaps or an infection wrecks a leaflet. A torrent floods an atrium with no room to take it. The pressure rockets back into the lungs. The patient drowns from within in hours. The colour jet can look small, since the brief early pressure equalises fast between the crowded chambers. The continuous wave trace cuts off early, a dagger that ends before systole does. A clinician reads that early cutoff and the sick patient as severe, whatever the jet size suggests. A normal-sized atrium with a torn valve and a crashing patient points to a severe acute leak. A clinician treats the whole picture, since the jet area alone can mislead. A papillary muscle can tear after a heart attack, dropping a leaflet without warning. A clinician reads a severe leak of sudden onset in a crashing patient as a surgical emergency. The atrium and the ventricle look normal in size, since the leak is new. A clinician reads that normal size as a mark of an acute leak.
Pitfalls in reading the jet
An eccentric jet fools the eye. A jet aimed at a leaflet flies off to the side and hugs the wall of the atrium. The wall-hugging jet flattens out and looks small on colour, the Coanda effect at work. A clinician judges such a jet as larger than it shows. The continuous wave beam struggles to line up with a sharply angled jet. A clinician hunts the off-axis windows to catch the eccentric leak. An eccentric jet takes patience to line up and read. A clinician follows an eccentric jet into the corner of the atrium for its true reach. The off-axis windows often catch what the standard view hides. A clinician reads such a jet up a grade from what the colour shows.
The settings sway every sign, so a clinician sets them with care. Too much colour gain blooms a jet past its true size. An overblown jet reads larger than the leak. A clinician sets the gain to a fair middle before reading the jet. The alignment sways the continuous wave trace, since an off-axis beam reads a faint signal. A clinician reads no single sign alone. A clinician builds the grade from the neck, the orifice, and the volume together. A grade that rests on agreeing measures holds up. A clinician escalates to a probe down the gullet when the bedside data clash. The closer view settles the mechanism and the true size of the leak. A clinician treats the agreeing measures as the grade, since one sign can deceive.
Following it and when to act
A graded leak sets the pace of follow-up. A clinician sets the next scan by the size of the leak and the state of the ventricle. A larger leak and a tiring ventricle both pull the next visit sooner. The size of the ventricle and its function steer the timing. A clinician measures the ventricle each visit, since a primary leak earns surgery once the muscle starts to slip. The handheld makes the serial check easy in the clinic. A clinician plots the ventricle’s size and function over the visits. A clinician stages the leak from the valve, the chambers, and the symptoms together. A severe leak with a tiring ventricle moves a patient toward repair. A clinician acts on a steady slip across visits more than a single reading.
Surgery answers a severe primary leak before the ventricle fails. A clinician refers once symptoms arrive or the ventricle starts to enlarge or weaken. A repair that saves the valve beats a replacement when the anatomy allows. The function can slip before symptoms show, so a clinician leans on the numbers as much as the patient’s story. The handheld catches that early slip at the bedside. A clinician refers a severe leak in good time for a repair. A clinician refers once the pumping fraction dips toward sixty in the hundred or the ventricle widens past four centimetres at rest. A repair that holds the patient’s own valve lasts longer than a replacement. A skilled centre repairs nearly all degenerative valves, which steers the referral.
A secondary leak is a problem of the ventricle as much as the valve. The stretched muscle pulls the leaflets apart, so the fix starts with the heart failure behind it. A clinician treats the failing ventricle first, with the drugs and the devices that shrink it. The leak can ease once the ventricle recovers. A clinician reads the leak again after the heart-failure care takes hold. A device that clips the leaflets can cut a leak that stays severe on full therapy. The handheld tracks the leak through each step of the care. A secondary leak that stays severe on full heart-failure therapy can earn a clip across the leaflets. The clip draws the leaflets together to cut the leak through a catheter. A clinician weighs that step in a patient who stays breathless on the best drugs.
Common questions about mitral regurgitation on Doppler
How does continuous wave Doppler assess mitral regurgitation?
Continuous wave Doppler reads the backward jet of the leak in systole. A clinician lays the beam down the jet and reads its density, its shape, and its speed. A dense envelope marks a large leak. The continuous wave trace also gives the speed-time tracing that feeds the regurgitant volume.
What does a dense continuous wave signal mean in mitral regurgitation?
The density of the signal tracks the number of red cells the leak throws back. A dense trace as strong as the forward flow marks a large leak. A faint trace marks a small one. A clinician reads the density with the gain set fair, since too much gain fakes a dense signal.
Can a handheld scanner assess mitral regurgitation?
Yes. A handheld runs colour flow and continuous wave on the one probe at the bedside. A clinician finds the jet on colour, lays the beam down it, and reads the leak. The handheld also measures the vena contracta and the flow for the orifice area. A clinician grades the leak from one bedside study.
What counts as severe mitral regurgitation?
A vena contracta at or above 0.7 cm marks severe mitral regurgitation. The effective orifice area sits at or above 0.40 cm squared, with a regurgitant volume at or above 60 mL. The regurgitant fraction reaches half the stroke or more. A clinician looks for several measures to agree before settling on severe.
Why can acute mitral regurgitation look mild on colour?
An acute leak floods a normal-sized atrium that has no room to take it. The pressure equalises fast between the crowded chambers, so the colour jet looks small. The continuous wave trace cuts off early. The patient is sick. A clinician reads the cutoff and the clinical picture as severe whatever the jet size suggests.

About the Author
Julien Mercier
Senior R&D Engineer · Medical Ultrasound Transducer Development
Senior R&D Engineer with an M.S. in Applied Physics and over 15 years of experience in medical ultrasound transducer development, specializing in the design verification and performance testing of high-frequency imaging transducers. Currently leading the development and verification of the company’s next-generation high-frequency linear-array transducer, responsible for imaging performance evaluation and reliability analysis in preclinical testing. Brings extensive hands-on experience in piezoelectric element tuning, beamforming parameter optimization, and system-level performance testing.