A warranty figure and a measured figure are different objects
Performance warranties on crystalline panels follow one shape. Output through the first year has to stay above 98 percent of nameplate. From year two onward the guaranteed annual loss is capped at 0.55 percent of nameplate. Twenty-four of those years take 13.2 points off, and 98.0 minus 13.2 lands on 84.8 percent at year 25. Datasheets print that figure as a headline. Nothing in the arithmetic came from measuring a panel. A warranty floor is a legal promise about the worst panel a manufacturer is willing to pay out on, set by a finance department around a claims rate the company can carry. Publishing a floor of 84.8 costs nothing when the typical panel finishes several points higher.
Two warranties travel together on a datasheet and get confused constantly. A product warranty, commonly 10 or 12 years, covers workmanship and outright failure of the hardware. A performance warranty, commonly 25 years, covers output alone. A panel making 90 percent of nameplate at year 12 with a cracked frame is a product warranty case with the performance clause untouched. A panel making 78 percent at year 20 with nothing visibly wrong is the reverse. Claims under the second clause stay rare. Proving output loss on an installed array takes an independent flash test at the owner’s expense.
A measured degradation rate is a slope. Record the output of a panel or a system over years, correct for irradiance and cell temperature, then fit a line through what remains. Field work at that scale exists. A US fleet study covering almost 8 GW across roughly 2,500 commercial and utility sites put the median loss at 0.75 percent per year across data running from 2008 to 2022. Systems in hot climate zones came in at 0.88 percent per year against 0.48 percent in cool ones. Ninety percent of the fleet lost under 2 percent per year. Figures of that kind describe populations, and one system inside the study could sit anywhere across the spread.
Fleet numbers also count more than panels. A system rate absorbs inverter ageing, soiling nobody washed off, string outages that went unnoticed for a month, connector corrosion and monitoring drift. Module-level measurements, taken by pulling panels off a rack and flashing them under a solar simulator, come out lower. Published module rates for crystalline silicon cluster near 0.5 to 0.6 percent per year at the median. That gap between 0.5 and 0.75 is real work sitting in the balance of system hardware and in maintenance that never happened. A panel datasheet and a fleet statistic report two different measurements.
Linear on paper, compound in the field
Warranty arithmetic subtracts a fixed slice of nameplate every year. Physics removes a fraction of whatever is left. Those two produce different curves from an identical percentage. Run the compounding version of the warranty clause. A panel losing 2 percent in year one and 0.55 percent of its remaining output in each year after that finishes at 0.98 times 0.9945 raised to the 24th power, which works out to 85.9 percent of nameplate at year 25. Reading the identical clause as a straight line gives 84.8. Compounding is the gentler of the two by 1.1 points. Landing exactly on 84.8 through compounding takes 0.60 percent per year. The linear wording is quietly the stricter of the two readings.
Twenty-five years is a warranty term. Treating it as a service life gets the physics wrong. Push the median module rate of 0.5 percent per year forward and ask when output reaches 80 percent of nameplate. The answer is the log of 0.8 divided by the log of 0.995, which comes to 44.5 years. Panels from the 1980s back that arithmetic up. Six Swiss installations built in the late 1980s and early 1990s were measured after more than 30 years of operation at 0.16 to 0.24 percent per year, well under the 0.75 to 1 percent the industry plans around. What ends a panel’s working life is rarely the slope. Hail, a failed junction box or a roof replacement gets there first.
Year one belongs to its own mechanism
First-year loss has a name and a mechanism behind it. Boron-oxygen light induced degradation appears in p-type Czochralski silicon within hours of first sunlight. Boron sits in the crystal as the dopant that makes the wafer p-type. Oxygen arrives during crystal growth, dissolved out of the fused silica crucible that holds the melt. Under illumination those two form a recombination-active complex. Carrier lifetime drops, and current falls with it. Published measurements on PERC cells put the peak near 2.3 percent at eight hours of exposure, settling back to about 1.3 percent by 96 hours. Float-zone silicon, grown with no crucible touching the melt, carries far less oxygen and shows almost none of the effect.
Swapping the dopant removes the complex. Gallium makes silicon p-type as boron does, with no defect formed against interstitial oxygen. Manufacturers knew that for two decades. A patent held the method closed until it expired in May 2020, after which the industry moved onto gallium doped p-type wafers within a couple of production cycles. Cells built that way still show a small residual drop, around 1.2 percent at 96 hours in one published comparison, arriving from a separate mechanism. N-type wafers avoid the problem from another direction entirely. Phosphorus doping puts no boron in the crystal at all. TOPCon and heterojunction cells are built on that material.
A datasheet clause allowing 2 percent in year one was written for boron-era panels. Gallium doped and n-type panels never spend that allowance. Their first-year loss lands closer to 1 percent. Later years then start from a higher base. Shifting the whole curve up by a point at year one carries that point through to year 25. Buyers reading a 2026 datasheet against a 2016 one see identical warranty language covering two different physical situations. The clause stayed put while the panels underneath it improved.
Checking which kind of panel is on offer takes one line of a datasheet. Cell technology reads as PERC, TOPCon or HJT. Wafer type reads as p-type or n-type, with gallium doping sometimes named in the wafer description. A p-type PERC panel built before 2020 carries the boron-oxygen problem in full. Anything built on n-type material never had it. Portable panels lag the utility market by a few years on cell technology, since folding laminators take whatever cell format runs at volume. Most folding panels on sale today still run p-type PERC cells.
The defect that waits for a hot afternoon
A second degradation mode turned up after PERC went mainstream. Light and elevated temperature induced degradation needs both conditions in its name. Illumination on its own does little. Above roughly 50 to 60 degrees at the cell, output starts falling across hundreds of hours of operation, reaches a minimum somewhere near a thousand hours, then partially recovers over thousands more. Reported magnitudes in PERC modules run to about 10 percent in bad cases, with individual measurements above that. Field studies have recorded 7 percent power loss after a thousand hours of laboratory exposure, corresponding to roughly three years installed. Suspicion points at hydrogen. Firing the silicon nitride layer drives hydrogen into the wafer to passivate defects. Too much of it appears to build the defect structure behind LeTID.
Cell temperature crosses that threshold routinely. Nominal operating cell temperature describes what a module reaches under 800 watts per square metre with 20 degree air and a light breeze, and 45 degrees is a typical datasheet figure. Scaling that 25 degree rise to full sun at 1,000 watts gives about 31 degrees above air temperature. A 35 degree afternoon puts the cells near 66. Every summer day in a hot climate runs a slow LeTID experiment on the array. A curve that falls for a thousand hours and then climbs back fits no straight line at all. A rate measured across the first three years of a LeTID-prone module reports a slope that will not continue. Production lines now run stabilisation steps, injecting current at controlled temperature to push the defect through its cycle before shipping.
What actually wears out
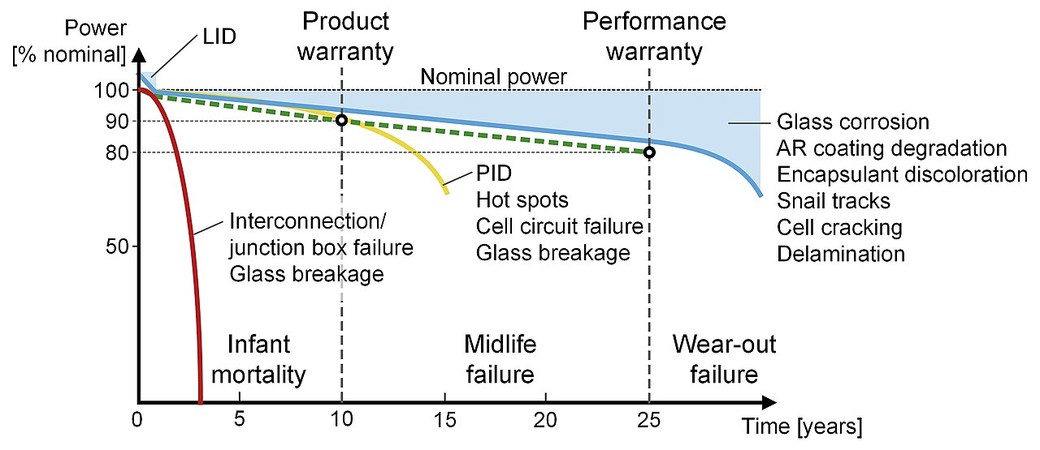
Failure types and the main degradation mechanisms of a module plotted against time, with dashed lines marking the product and performance warranties. Each phase has its own list of causes. Figure by Cesar Dominguez, CC BY-SA 4.0.
Wear-out is a collection of separate failures competing to arrive first. Encapsulant browning cuts the light reaching the cells. Each percent of transmission lost is a percent of current lost. Solder bond fatigue works along a different path. Twenty-five years of daily heating and cooling flexes the joints between interconnect ribbons and cell metallisation, cracks propagate through the solder, and series resistance climbs. Arithmetic makes the difference between those two mechanisms concrete. A 100 watt panel operating near 18 volts draws about 5.56 amps at its maximum power point. Adding 0.1 ohm of series resistance costs 5.56 squared times 0.1, which is 3.1 watts, over 3 percent of the panel. Losing 1 percent of transmission through a yellowed encapsulant costs 1 watt. Current enters the resistance loss squared, which is why interconnect fatigue dominates the wear-out phase in field data while optical losses accumulate gently. Cracked cells sit between the two. A crack costs nothing until it isolates part of the cell from its fingers, at which point that area stops contributing current. Backsheet cracking lets moisture into the laminate, corrosion follows on the ribbons, and resistance climbs again. Bypass diodes fail short or open, taking a third of the panel out in the first case and removing shade protection in the second. Potential induced degradation needs a driving voltage between cells and a grounded frame, which utility strings at 1,000 or 1,500 volts supply and a portable panel does not. Reading the mechanism off a measurement is possible with nothing opened up. An IV curve sweep separates them cleanly. Transmission losses drop short circuit current while leaving fill factor and open circuit voltage near their original values. Series resistance losses flatten the knee of the curve and cut fill factor while current and voltage hold. Shunting and PID pull open circuit voltage down and bite hardest at low light. Three mechanisms, three signatures, one instrument. Technicians use exactly that logic before deciding whether a string needs washing, rewiring or replacing. A yearly percentage hides the fact that these processes run on different clocks. Optical loss is roughly linear with dose. Fatigue accumulates with cycle count and turns up as a knee in place of a slope. Averaging them into one number per year works for a fleet and misleads for a panel.
Heat sets the clock
Every chemical process behind those failures speeds up with temperature. Arrhenius gives the shape, with rate scaling as the exponential of minus an activation energy over kT. The fleet data has a factor of two sitting in it already, 0.88 percent per year in hot zones against 0.48 in cool ones. Work backwards from a doubling across 10 degrees near room temperature. Activation energy equals the log of 2 times the gas constant, divided by one over 298 minus one over 308. That comes to 52.9 kilojoules per mole, or 0.55 electron volts. Polymer hydrolysis, metal diffusion and corrosion reactions inside a laminate all sit in the 0.5 to 1.0 electron volt band. Ordinary chemistry accounts for the field ratio with nothing exotic invoked. Carry that ratio out to year 25 and the cost turns visible. A module losing 0.88 percent of its remaining output annually sits at 80.2 percent after 25 years. At 0.48 percent it sits at 88.7 percent. Eight and a half points separate a desert install from a coastal one, with identical panels on both racks.
Module temperature runs well above air temperature. That difference is large. A panel in full sun with air moving behind it runs about 30 degrees above ambient. Mounting one flat against a roof with no gap runs hotter still. Anything improving airflow behind the laminate buys years at the far end of its life. Site choice does more than panel choice for a fixed array. A folding panel gets identical physics with a twist, since fabric backing traps heat against the cells while the panel lies on hot ground. Propping it on its own stand keeps air moving underneath. Ten degrees of module temperature is worth a factor of two on every reaction in the laminate.
Why the rate is hard to measure at all
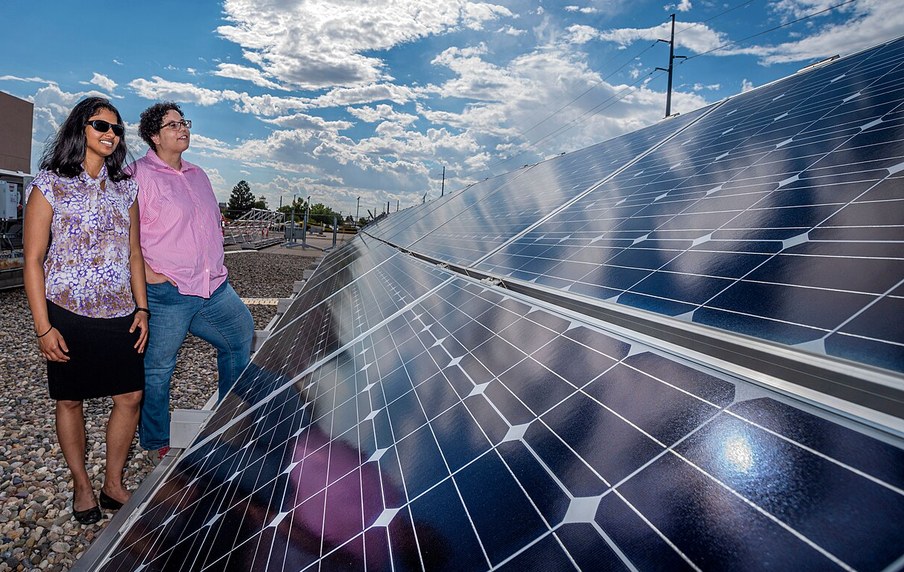
Monocrystalline modules on an outdoor test rack at a US national laboratory, where output is logged for years so that ageing can be separated from weather. Photo by the US Department of Energy, public domain.
Measuring 0.5 percent a year against weather that varies by several percent a year is a signal to noise problem. Annual insolation at a site swings with cloud cover. Correcting output for measured irradiance and cell temperature removes most of that, leaving residual year-to-year scatter of 2 to 3 percent in normalised annual yield. Fitting a straight line to N annual points gives a slope whose standard error is sigma times the square root of 12 divided by N times N squared minus 1. Numbers make the consequence plain. At 3 percent scatter, five years of data give a standard error of 0.95 percent per year.
Extending the record shrinks that quickly. Ten years brings the standard error to 0.33 percent per year, fifteen years to 0.18, twenty years to 0.12. Separating a 0.5 percent slope from zero at two standard errors needs the error under 0.25, which arrives around year twelve. Below that, a single system supports only a wide range. The fleet study whose median came out at 0.75 percent had a mean system age of five years. That result holds up because averaging thousands of noisy slopes gives a precise average. Asking an identical dataset for the rate of one particular site returns something close to a shrug.
Vendor claims of measured degradation deserve that arithmetic applied to them. A panel tested for two years and reported at 0.3 percent per year carries an uncertainty several times the number quoted. Accelerated tests answer a different question again. IEC 61215 runs 200 thermal cycles between minus 40 and plus 85 degrees, 1,000 hours of damp heat at 85 degrees and 85 percent humidity, ten humidity freeze cycles and 15 kilowatt hours per square metre of ultraviolet preconditioning. Passing means under 5 percent power loss across the sequence. Those tests screen out design faults and manufacturing mistakes. Converting hours in a chamber into years on a roof has never worked reliably.
A folding panel ages by other rules
Portable panels skip several of the mechanisms that dominate rooftop ageing. Potential induced degradation needs hundreds of volts between cells and a grounded frame. A folding 100 watt panel opens at around 20 volts into a power station, carries a fabric edge in place of an aluminium frame and has nothing bonded to earth. That driving voltage is absent. Glass corrosion cannot happen with no glass present. What takes the place of glass matters a great deal, since the front sheet is a polymer laminate, usually PET or ETFE. PET yellows under combined ultraviolet and heat, and hydrolysis breaks the polymer chains once moisture gets in above about 45 degrees. Transmission falls as the sheet goes amber. ETFE is a fluoropolymer, holds its clarity far longer and costs more. On a folding panel the front sheet sets the service life before the cells get a say.
Exposure accounting cuts the other way, in the owner’s favour. A fixed rooftop array collects somewhere near 1,500 to 1,900 kilowatt hours per square metre every year for decades. A folding panel used twenty days a year at 5 kilowatt hours per square metre a day collects 100. Ultraviolet dose and thermal cycling accumulate roughly fifteen times slower on the second one. Ten calendar years on a camping panel is closer to one year of rooftop exposure in optical terms. Mechanical wear replaces photochemical wear as the thing that finishes it off. Folding puts a crease line across the laminate at every hinge, cells near the fold pick up microcracks, the junction box gets tugged by cable strain, and connectors wear with every plug cycle. Panels stored in a hot vehicle age their polymer with no light and no output to show for it. Rates quoted per year, written for panels that sit still for 25 years, describe this product badly.
What to expect from a panel you own
A rigid mono panel on a rack gives numbers a buyer can plan around. Expect a first-year drop of 1 to 2 percent depending on wafer type, then somewhere between 0.4 and 0.7 percent a year in a temperate climate, closer to 0.9 in desert heat. Output at year 25 lands near 85 to 90 percent of nameplate for a panel that survives mechanically. Most panels lost before then are lost for reasons with nothing to do with the slope. Hail, a cracked junction box and a chewed cable end more panels than photochemistry does.
Degradation figures for crystalline panels, with the arithmetic or the source behind each one
Quantity
Figure
Where it comes from
Warranty floor, year 1
98.0 percent of nameplate
typical linear performance warranty
Warranty cap, years 2 to 25
0.55 percent of nameplate per year
same warranty
Warranty floor, year 25
84.8 percent
98.0 minus 0.55 times 24
Compounded rate matching that floor
0.60 percent per year
0.848 over 0.98, across 24 years
Result of 0.55 percent compounded
85.9 percent at year 25
0.98 times 0.9945 to the 24th
Fleet median, system level
0.75 percent per year
2,500 US sites, 8 GW, 2008 to 2022
Hot climate zones
0.88 percent per year
same dataset
Cool climate zones
0.48 percent per year
same dataset
Swiss systems past 30 years
0.16 to 0.24 percent per year
six installations from the late 1980s
Years to reach 80 percent at 0.5 percent
44.5 years
log 0.8 divided by log 0.995
Boron-oxygen LID, p-type PERC
2.3 percent peak at 8 h, 1.3 percent at 96 h
published PERC cell measurements
Gallium doped equivalent
1.2 percent at 96 h
same comparison
LeTID onset
above roughly 50 to 60 degrees at the cell
laboratory and field reports
Temperature coefficient of power, mono PERC
minus 0.34 to minus 0.37 percent per degree
datasheet range, TOPCon runs minus 0.29 to minus 0.32
Series resistance cost, 100 W panel
3.1 watts per 0.1 ohm added
5.56 amps squared times 0.1
IEC 61215 thermal cycling
200 cycles, minus 40 to plus 85 degrees
qualification sequence
IEC 61215 damp heat
1,000 hours at 85 degrees, 85 percent RH
qualification sequence
Qualification pass threshold
under 5 percent power loss
measured before and after each sequence
Folding panels need a different frame of expectation. Cell degradation barely registers across a decade of weekend use. Front sheet clouding, hinge wear and connector damage arrive well ahead of it. Buying decisions follow from that ordering. ETFE over PET, a stand that lifts the panel off hot ground, a case that keeps grit out of the folds, and cables long enough that the junction box never takes strain. Checking output once a season against a known load catches a failing bypass diode or a wet junction box long before the loss grows obvious. A panel reading 15 percent low at noon on a clear day has something broken inside it.
Common questions
How much power will my panel lose in a year?
Between 0.4 and 0.7 percent for a modern mono panel in a temperate climate, closer to 0.9 percent where modules run hot. Year one is separate and larger, at 1 to 2 percent depending on wafer type. Nothing about a single year is measurable on your own equipment.
Does a 25-year warranty mean the panel stops working at 25 years?
No. At the median measured rate a panel reaches 80 percent of nameplate around year 44. Twenty-five years is the term a manufacturer is willing to underwrite, chosen for commercial reasons. Panels from the late 1980s are still running above 90 percent.
My new panel measured below its rating on the first day. Is that degradation?
Almost certainly not. Nameplate power is measured at 1,000 watts per square metre with the cells held at 25 degrees. Outdoors at 66 degrees a mono PERC panel loses about 0.35 percent per degree above 25, which is 14 percent gone before anything ages. Add irradiance below 1,000 and the gap widens further.
Can I slow degradation down?
Temperature is the one lever an owner controls. Keep air moving behind the laminate, avoid mounting flat against a hot surface, and do not leave a folding panel closed up in a vehicle in summer. Ten degrees cooler roughly halves the rate of every reaction inside.
Is a folding panel’s yearly rate different from a rooftop panel’s?
The cells age by identical chemistry at identical temperature. Duty cycle changes everything else. Twenty days of use a year is a fifteenth of the exposure a rooftop panel gets. What kills a folding panel is usually a crease, a cracked junction box or a worn connector.