










Cardiac function
Ejection Fraction EF Measurement With Handheld Ultrasound Technique
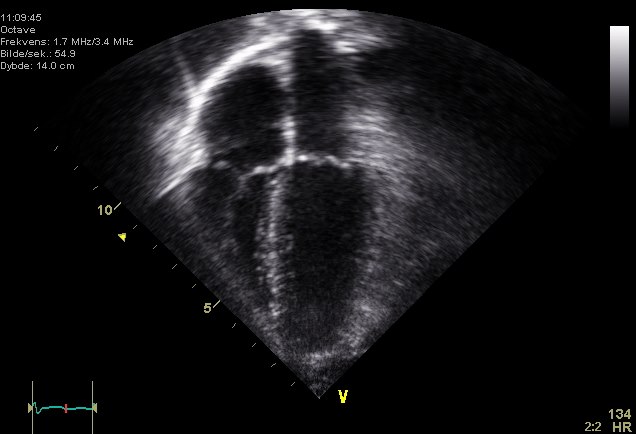
No number is asked of cardiac ultrasound more often than the ejection fraction, and none is leaned on harder for a referral, a drug choice, or a hospital bed. It is the share of blood the left ventricle pushes out each beat: a chamber holding 120 milliliters at the end of filling that ejects 70 leaves a fraction near 58 percent. A handheld probe can produce it at the bedside in a minute, and how it is produced decides whether the number can be trusted at all.
What the fraction measures
The number describes one action only: how forcefully the left ventricle squeezes. It says nothing about a stiff ventricle that fills poorly, a leaking valve, or a struggling right heart. A patient can carry a healthy ejection fraction and a failing heart at the same time, which is why the figure is read as one line in a fuller report. Holding that limit in mind keeps a reader from treating the percentage as a verdict on the whole organ.
Two volumes feed the calculation. The end-diastolic volume is the chamber at its fullest, the instant before the mitral valve shuts. The end-systolic volume is the chamber at its smallest, the bottom of the squeeze. The fraction is the difference between them as a share of the full volume. Every method of measuring ejection fraction, by eye or by tracing, is in the end an attempt to judge those two volumes from a moving grey image.
That single percentage has become a shared language across cardiology, oncology, emergency medicine and intensive care. A heart-failure category references it. So does a chemotherapy stop rule. So does a resuscitation call. The figure crosses specialties because it compresses a complex pump into one number a non-cardiologist can act on. The cost of that convenience is the temptation to trust the number without asking how it was made.
Two roads to the number
There are two honest ways to reach the figure with ultrasound, and they sit at opposite ends of effort. The first is the trained eye. An experienced reader watches the left ventricle beat in a clear view, sees how far the walls close in and how briskly they do it, then names a band: low, low-normal, normal, hyperdynamic. This looks like guesswork to a beginner. It is nothing of the kind. Studies that set visual estimates against the formally traced number find them closely matched in trained hands, the eye landing within a couple of percent on average, and emergency readers catching a genuinely weak ventricle with high sensitivity. The visual read is fast. It works on an image too rough to trace. It sharpens with every heart a reader has watched. Its weakness is that it lives inside the reader. It travels poorly between people. It resists being written as a number a chart can trend. It offers no defence when a figure is questioned.
The second road is measurement, and the standard one carries the name Simpson. The Simpson biplane method, the method of discs, asks the reader to trace the inner edge of the left ventricle twice in each of two views, once when the chamber is fullest and once when it is smallest. The software slices the outlined cavity into a stack of thin discs, computes the volume of each, sums them into a full-chamber volume and an emptied-chamber volume, then returns the fraction between the two. Performed in the apical four-chamber view and the apical two-chamber view set at right angles to it, this is the figure professional societies recommend, the closest ultrasound comes to a number a clinician can defend. It is also the slowest and the heaviest step in a bedside scan, since every tap of the tracing tool moves the answer.
Where the traced number goes wrong
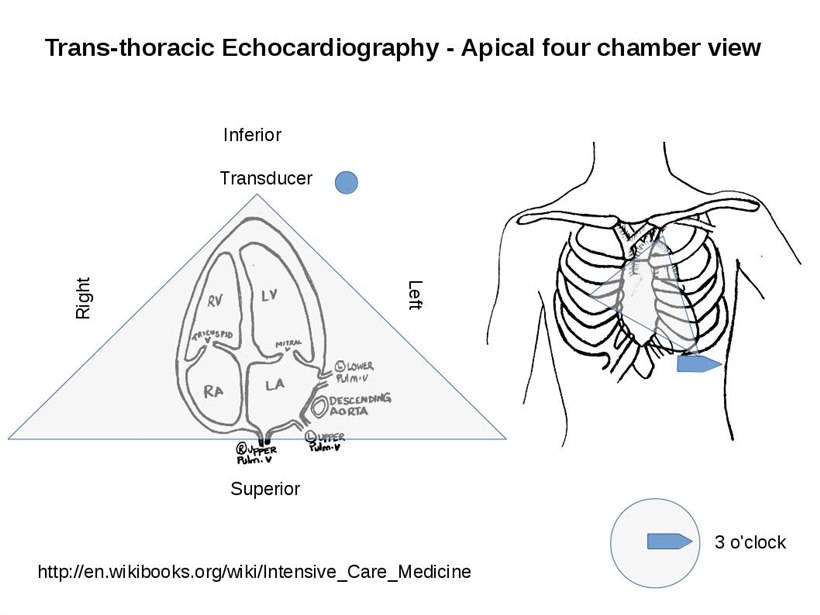
The Simpson method is exact about arithmetic and unforgiving about inputs, so its errors come from the picture, never the maths. The first error is foreshortening. When the probe sits a little off the true apex, the beam cuts a short stubby ventricle in place of the full long one. The traced volumes shrink. The fraction reads falsely high. A foreshortened apical view is the commonest reason a handheld ejection fraction flatters a sick heart. The fix is mechanical: slide the probe down and out to find the apex that gives the longest ventricle, then distrust a chamber that looks rounder or shorter than the heart should be. A genuine apical window puts the apex at the top of the screen, the ventricle pointing straight down the beam, with the wall thinning to a fine point. The papillary muscles should sit symmetrically, the cavity reaching its true length. An apex that looks crowded or stubby is the cue to reposition and try again before any tracing begins. A blunt dome at the top of the screen is the signature of a foreshortened cut. The second error is the tracing line. The reader has to follow the true inner border of muscle, the endocardium. The papillary muscles that jut into the cavity are no part of the wall. A line that strays onto a papillary muscle, or onto the bright clutter near the apex, carves volume out of the chamber and skews the result. A weak image makes this harder, since a border the reader cannot see is a border the reader guesses. The third error is timing. The full-chamber trace belongs to the frame just before the mitral valve shuts, the emptied-chamber trace to the frame where the cavity is smallest. Choosing the wrong frames feeds wrong volumes into an otherwise perfect calculation. None of these is an exotic failure. Each is an everyday slip that a careful reader heads off by working the view before working the tracing tool. A clean apical four-chamber image, caught at the true apex with the whole endocardium in sight, closes nearly every door through which the number can lie. The reader who spends the time on the image spends little on the trace. The reader who rushes the image spends the rest of the study doubting the answer. That order, image first and tracing second, is the quiet discipline behind a defensible bedside ejection fraction. It is also the step a handheld scan skips first under time pressure. The machine will trace whatever outline it is handed and return a confident percentage either way, which is the exact reason the confidence of the output is no guide to the truth of the input. A fourth trap waits in the diseased heart itself. The Simpson method assumes the ventricle empties evenly, so a heart with a dead segment that bulges where it should contract breaks that assumption, the discs over one wall behaving nothing like the discs over another. A reader who traces such a ventricle in a single plane can miss the regional failure entirely, which is why the biplane pairing of two perpendicular views exists: the second view catches what the first one hides. A handheld scan that captures only one clean view, the four-chamber, returns a single-plane estimate that a reader weighs with that limit in mind.
The picture decides, not the arithmetic
Simpson’s errors come from the image, never the maths. A reader who works the view clean spends little on the trace that follows.
What the bedside chooses
A handheld scan rarely needs the eye and the trace together. Choosing between them is a question about the clinical question.
When the ask is binary, is this ventricle working or failing, the trained eye answers in seconds and answers well enough. A breathless patient in a corridor, a trauma call, a fast sort of the sick from the stable: these want a direction within seconds. Spending three minutes tracing two views to return fifty-five percent, when the only decision is to start treatment or hold off, burns the minutes the patient may not have.
When the ask is a number that has to be written down, trended across visits, or defended to another clinician, the traced figure is the one that holds up. A heart-failure clinic following a drug, a chemotherapy patient whose ventricle is watched for damage: a percentage that lands in a chart needs a method standing behind it.
The device shapes the choice as much as the question does. A small screen and a touch interface make a precise endocardial trace harder than the same trace on a full cart, the line coarser and the tap less exact. So a wise bedside reader leans on the visual read for triage and saves the formal trace for the studies that call for the extra care. The point of the handheld is reach, a probe in a pocket where a cart could never go. A fast confident eye protects that reach, the right tool for a triage read on a small screen.
Reading the number once it appears
A figure becomes an answer only once it is set against a range and against the patient.
Professional reference puts a healthy left-ventricular ejection fraction in the low-fifties to low-seventies percent, a shade higher in women than in men. The American Society of Echocardiography sets the normal floor near 52 percent in men and 54 in women, with reduced function graded below that. A reading inside the band is reassurance. A reading well below it is a finding that changes the plan.
The bands carry more weight than the decimals. Mildly, moderately and severely reduced are the steps a treatment plan turns on. A handheld figure good to within a band is the honest reading. A false decimal claims a precision the image cannot support.
A reader who reports a careful band states a truth the method stands behind. A reader who reports a precise number the image cannot justify states a fiction with a decimal point. The discipline is to report no more precision than the picture supports. A confident wrong number does real harm at the bedside, where an honest range guides the next step safely.
A handheld probe places that one decisive line in a clinician’s hand at the bedside, in the minute it is needed. The reach is the gift, a pump assessed where no cart could reach. Respecting how the number was made, alongside what it does and does not say, is the price that keeps the gift honest. A handheld ejection fraction reported with that care is a genuine clinical tool. The same number reported without it is a guess wearing a percentage sign.
Common questions about handheld ejection fraction
What is ejection fraction?
It is the share of blood the left ventricle pushes out with each beat, the gap between the full chamber and the emptied chamber divided by the full chamber. A ventricle that holds 120 milliliters and ejects 70 sits near 58 percent.
What does a normal ejection fraction read?
The American Society of Echocardiography puts the normal floor near 52 percent in men and 54 in women, with reduced function graded below that. A healthy range runs into the low seventies.
How is it measured on a handheld probe?
Two ways: a trained visual estimate of how briskly the walls close, fast and good for triage, or the Simpson biplane trace of the chamber in two views, slower and written down for a chart.
Why does a foreshortened view raise the number falsely?
An off-apex probe cuts a short stubby ventricle in place of the full long one, shrinking the traced volumes so the fraction reads falsely high. Sliding to the true apex for the longest ventricle fixes it.
When is the visual estimate enough?
When the question is binary, whether the ventricle works or fails, a trained eye answers in seconds. The formal trace is saved for a number that lands in a chart, gets trended, or is defended to another clinician.
Can a handheld figure be trusted?
Reported as a band, by a reader who worked the apical view before the tracing tool, it is a genuine clinical tool. Reported without that care, it is a guess wearing a percentage sign.

About the Author
Julien Mercier
Senior R&D Engineer · Medical Ultrasound Transducer Development
Senior R&D Engineer with an M.S. in Applied Physics and over 15 years of experience in medical ultrasound transducer development, specializing in the design verification and performance testing of high-frequency imaging transducers. Currently leading the development and verification of the company’s next-generation high-frequency linear-array transducer, responsible for imaging performance evaluation and reliability analysis in preclinical testing. Brings extensive hands-on experience in piezoelectric element tuning, beamforming parameter optimization, and system-level performance testing.