
In 2024, global lithium mine output reached approximately 240,000 metric tons. Australia produced 88,000 tons, Chile 49,000 tons, China 41,000 tons, Zimbabwe 22,000 tons, and Argentina 18,000 tons. At the corporate level, SQM, Albemarle, Tianqi, Ganfeng, and Pilbara Minerals account for roughly half of global market share.
The numbers themselves reveal little. The more pertinent question is: why does a mineral central to global energy transition exhibit such a skewed production geography? The answer lies at the intersection of geology, capital, and policy.
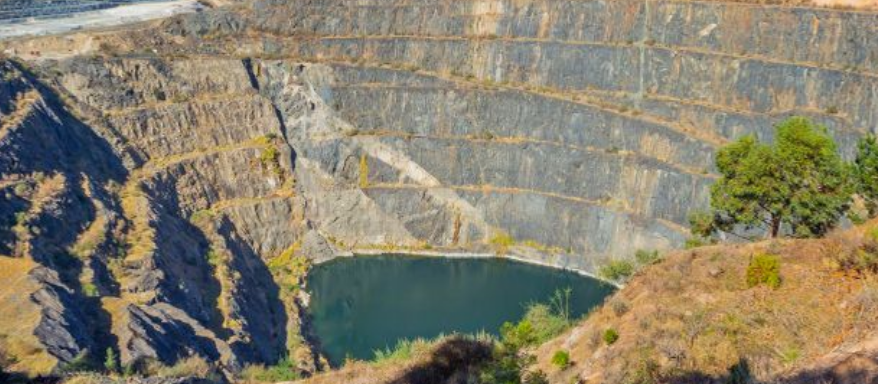
Open-pit mining operations in Western Australia, home to the world's largest hard-rock lithium deposits
Australia
The Greenbushes mine in Western Australia is the world's largest lithium mine by output. Ore grade reaches 2.4% lithium oxide, exceeding other major deposits. Control rests with Talison, a joint venture between Tianqi Lithium (51%) and Albemarle (49%). Pilgangoora and Mt Marion share similar equity structures, with Chinese capital holding primary positions.
Australia contributes 37% of global lithium mine production. Decision-making authority over profit distribution does not reside in Canberra. The ore is extracted, shipped to China for processing, and value-added stages occur overseas. Australia's role in the lithium value chain resembles that of an extraction contractor.
Hard-rock lithium mines require three to five years from exploration to production. Brine projects take seven to ten years. During the period of accelerating electric vehicle demand, Australia's faster turnaround enabled it to capture production share. Where the profits corresponding to that share flow depends on equity structure.
Chile
The Atacama salt flat contains brine with lithium concentration of 1,800 ppm. Production costs run $3,000-5,000 per ton, roughly 40% lower than hard-rock operations. SQM and Albemarle are the only two operators.
In 2023, the Boric administration introduced the National Lithium Strategy, requiring Codelco to hold majority stakes in all new projects. The SQM-Codelco agreement finalized in late 2024 mandates that from 2031, 85% of operating profits go to the state.
Chile holds 31% of global lithium reserves. New investment is sensitive to policy signals. Argentina reduced mining royalties from 8% to 4%. Zimbabwe opened its doors to Chinese capital. Chile is tightening. In 2024, Chilean production grew 18.4%, driven by existing projects. New project investment is flowing elsewhere.
Whether Chilean policy can maintain production levels while increasing state revenue remains undetermined. If successful, other resource-rich nations will follow suit. If production stagnates, market share will shift to neighbors with more permissive policies.
China
China's lithium mine output of 41,000 tons represents just 17% of global production. This figure understates China's position in the lithium value chain.
China processes 60-70% of global lithium. In 2024, Chinese facilities produced 700,000 tonnes of lithium carbonate and 360,000-410,000 tonnes of lithium hydroxide. China accounts for 98% of global LFP cathode material production and 67% of ternary cathode materials. Eight of the world's ten largest battery manufacturers are Chinese.
Lithium value chain profits concentrate in processing. Australian spodumene and Chilean brine predominantly ship to China for conversion into battery-grade materials, entering CATL and BYD supply chains. Ore-exporting nations capture raw material prices. China captures the processing margin.
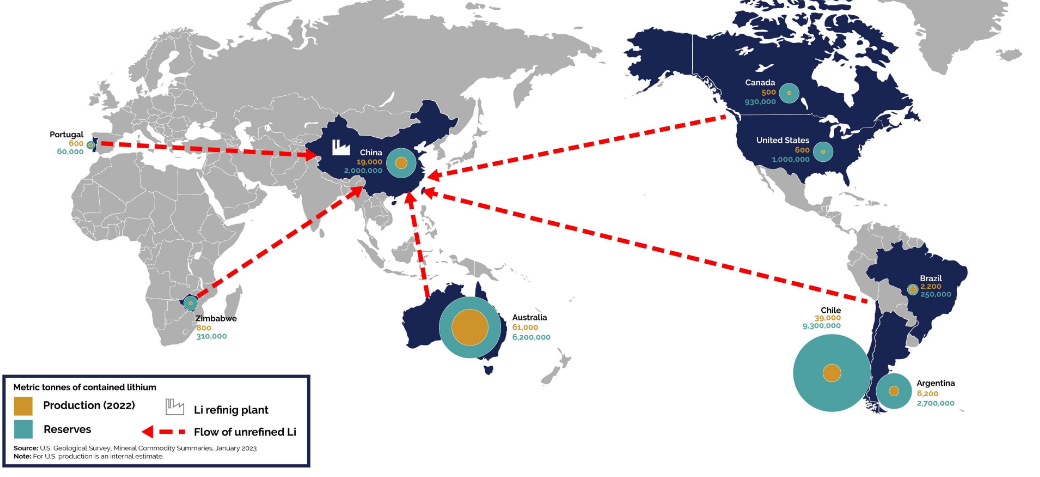
China processes 60-70% of global lithium into battery-grade chemicals
In 2025, Beijing imposed export controls on eight battery technologies: LFP cathode processes, lithium extraction techniques, high-energy-density battery designs (above 300Wh/kg), and manufacturing equipment. The difficulty for Western nations to build equivalent processing capacity has increased.
Jiangxi's lepidolite mines require 200 tons of ore to produce 1 ton of lithium carbonate, with costs exceeding imports. China continues mining. The objective is reducing dependence on imported ore, even at short-term losses.
Zimbabwe
Following Chinese capital inflows, the Bikita and Arcadia mines commenced production. Zimbabwe's output grew 47.7% in one year to 22,000 tons, making it Africa's largest lithium producer. Cumulative investment totals approximately $1.4 billion.
The Zimbabwe government banned raw ore exports in 2022. In 2025, it announced that from 2027, lithium concentrate exports would be prohibited, permitting only lithium sulfate and other processed products. The intent is to compel investors to build local processing facilities.
Zimbabwe faces gaps in power supply, technical personnel, and supporting industrial chains. Mandatory processing localization may constrain output growth rather than achieve value chain upgrading. Export restrictions serve as a negotiating tool with limited effectiveness.
Argentina
The Milei administration's RIGI framework: royalties reduced from 8% to 4%, 30-year tax stability, 100% foreign currency retention. Rio Tinto committed $2.5 billion to develop the Rincon project. Ganfeng's Mariana project began production in February 2025. Argentine output doubled in one year to 18,000 tons.
Argentina's brine grades (400-900 ppm) fall below Chile's. Policy conditions compensate for the resource gap. With Chile tightening and Bolivia maintaining its nationalization framework, Argentina has become the Lithium Triangle nation receiving the most investment inflows.
The Five Companies
SQM holds 18% of global production with a cost structure allowing continued operation in low-price environments. When lithium prices fell 87% in 2024, SQM maintained production. From 2031, 85% of profits go to the Chilean government. The company's nature is shifting from mining enterprise to state extraction contractor.
Albemarle is the largest Western lithium company. Revenue declined 48% in 2024, with capital expenditure cut by 50%. The U.S. government provided $240 million in subsidies. Albemarle holds 49% of Greenbushes equity, with control residing at Tianqi. Cost structure faces pressure at current prices.
Tianqi reported losses of 5.7 billion yuan in the first nine months of 2024. The Kwinana lithium hydroxide plant in Australia operates with difficulty, and the second-phase expansion was cancelled. The issue lies in pricing structure: spodumene procurement prices locked at high levels while lithium chemical selling prices fell with the market, squeezing profit margins.
Ganfeng has operations across Argentina, Mali, Australia, and China, with long-term agreements with Tesla, BMW, and Volkswagen. Assets are dispersed with varying quality. Goulamina commenced production during a price trough. Mali carries political uncertainty.
Pilbara Minerals operates independently without joint ventures or downstream involvement. Decision-making efficiency is high, but value chain bargaining power is limited. The January 2025 acquisition of Brazil's Salinas project for A$560 million reduces dependence on the single Australian market.
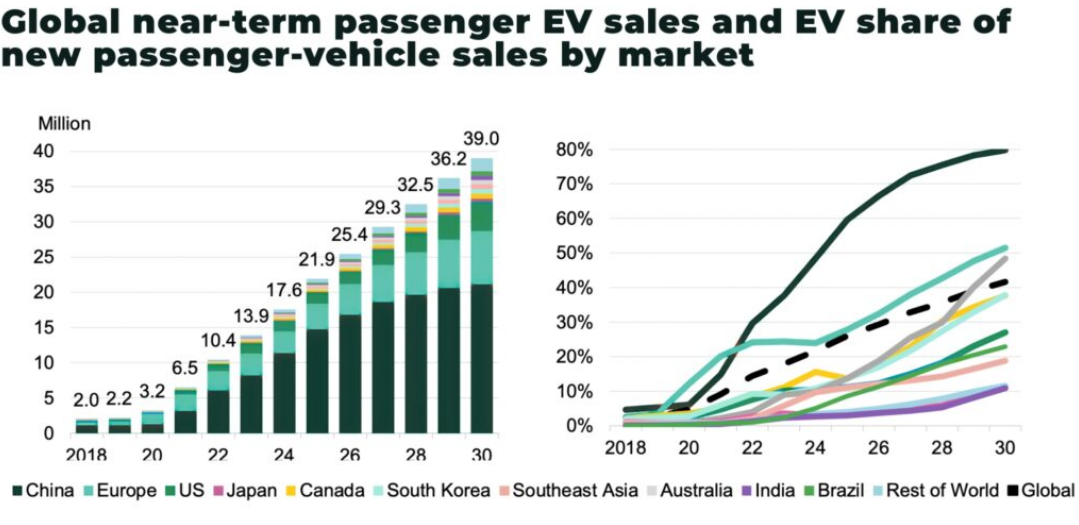
Global EV sales reached 17 million units in 2024, with battery applications consuming 87% of lithium production
Price and Supply-Demand
Lithium carbonate reached $80,000 per ton in late 2022. By late 2024, it had fallen to $10,000, an 87% decline.
The cause: 2022's high prices stimulated simultaneous expansion in Australia, China, and Zimbabwe, with Chinese lepidolite capacity releasing beyond expectations. On the demand side, EV penetration growth in Europe and North America slowed, and subsidies decreased.
The 2025 surplus narrows to 10,000 tons, with a possible shift to shortage in 2026. In January 2026, Chinese lithium carbonate futures exceeded 150,000 yuan per ton, up 30% from the start of the year.
Current prices remain insufficient to support new mine investment. Lithium projects require over a decade from exploration to production. Projects delayed in 2024-2025 will create supply gaps around 2030. Price increases at that point will stimulate another investment round, followed again by oversupply. The cycle will repeat.
Electric Vehicle Demand
Global EV sales reached 17 million units in 2024, with penetration exceeding 20%. China sold 11 million units, with penetration approaching 60%. Each vehicle contains 8-12 kilograms of lithium. Battery applications account for 87% of lithium consumption, up from 65% a decade ago.
Lithium demand correlates closely with EV sales. Demand predictability has improved, but sensitivity to EV market fluctuations has increased correspondingly. Economic cycles, charging infrastructure, and consumer preference shifts all transmit to lithium demand.
GM invested $625 million in Lithium Americas. Ford signed long-term agreements for over 100,000 tons of lithium hydroxide. Tesla signed a ten-year supply agreement with Piedmont. Automakers are locking in capacity to reduce spot market exposure.
Automaker lithium investments remain limited relative to demand growth. If supply gaps materialize around 2030, battery material shortages will constrain vehicle production capacity utilization.
Structure
The literal answer to "who are the top five lithium producers" is straightforward. Information beyond the literal answer holds greater value.
Mines are in Australia and South America. Processing is in China. Mining margins are low. Processing margins are high. Western efforts to build processing capacity face gaps in technology, cost, and talent. Chinese export controls increase the difficulty of catching up.
Resource nations want larger revenue shares. Policy tightening affects investment inflows. Chile and Zimbabwe are testing tightening approaches. Argentina has chosen loosening. Which model proves effective long-term remains undetermined.
Lithium price cycles will persist. Current prices suppress new mine investment. Demand growth points to future supply gaps. Investors choosing to enter at the trough or wait for price recovery both face risks.
This industry's geographic mismatch, value chain mismatch, and cycle mismatch will persist over the coming decade. Participants who can exploit mismatches will capture excess returns. Under the current structure, Chinese processing companies occupy a position closer to that advantage than any mining company.