
All of them. Every chemistry, every format, every application.
What took me a long time to understand, and what I think most engineers get wrong when they first encounter the field, is where the actual difficulty concentrates. There is an assumption, usually unstated, that dangerous batteries need sophisticated monitoring and safe batteries need simple monitoring. High energy density means high risk means high monitoring complexity. Low energy density, high thermal stability, long cycle life means the BMS can be basic.
This assumption is wrong. Or rather, it is incomplete in ways that lead to expensive mistakes.

lithium battery manufacturing
LFP has become the default chemistry for applications that prioritize safety and longevity over energy density. Grid storage runs almost entirely on LFP now. Chinese EV manufacturers have shifted heavily toward it. The thermal runaway threshold sits above 270°C. Cycle life extends into the thousands. No cobalt supply chain exposure. The procurement pitch writes itself.
What procurement does not know, because procurement talks to sales and sales does not understand the electrochemistry, is that LFP creates state-of-charge estimation problems that have occupied hundreds of researchers for over a decade and still lack fully satisfactory solutions. The chemistry that everyone calls safe and boring turns out to be genuinely difficult to monitor accurately. Not dangerous. Difficult. The failure mode is not fire. The failure mode is showing the driver 250km of range and running out of power 180km later.
NCA and NMC 811, by contrast, have thermal characteristics that demand extreme vigilance. Runaway onset around 150°C for NCA. Maybe 210°C for NMC 811. When these cells fail they fail violently. The BMS must respond in microseconds. Dual redundant processors. Hardware protection paths that function even if the main controller has crashed. Temperature sensing dense enough to catch hot spots before propagation.
But the voltage curve cooperates. The OCV-SOC relationship is monotonic across most of the operating range. Standard estimation algorithms work the way the textbooks say they should. The difficulty is thermal physics, not information theory.
I want to spend most of this piece on LFP because I think the monitoring challenges there are underappreciated. The high-nickel thermal story is well understood. People know those batteries are dangerous and build systems accordingly. The LFP estimation story is less familiar and causes more subtle problems.
The Voltage Plateau
Padhi and colleagues published the foundational work on LFP cathode materials in 1997. The paper explained the electrochemistry at the molecular level. Lithium iron phosphate exists in two phases during charge and discharge: a lithiated phase (LiFePO4) and a delithiated phase (FePO4). These phases belong to the same crystal space group. Gibbs phase rule dictates that when two phases of the same component coexist in equilibrium, the chemical potential and therefore the voltage remain constant as the relative proportions shift.
This is not a design flaw that clever engineering can fix. It is thermodynamics. The flat voltage plateau is intrinsic to the olivine crystal structure that gives LFP its stability and cycle life.
In practical terms the flatness manifests as follows. Between roughly 20% and 80% state of charge, the open-circuit voltage of an LFP cell changes by somewhere between 50 and 100 millivolts total. The exact number depends on the specific cell design, the electrode formulation, the temperature, and the measurement conditions. But the order of magnitude is consistent. One comparative study put the voltage change from 20% to 80% SOC at approximately 0.47V for NMC and roughly 0.1V for LFP.
Within the flattest portion of the LFP curve, typically somewhere in the 35% to 65% SOC range, the voltage might change by 30mV across 30% of usable capacity. Maybe less.
Now think about what this means for state estimation.
The standard approach to SOC estimation in lithium batteries uses the relationship between open-circuit voltage and state of charge. Every lithium chemistry has a characteristic OCV-SOC curve that can be measured in the laboratory and stored in the BMS as a lookup table or a polynomial fit. During operation, when the battery reaches a rest state, the BMS measures the terminal voltage, waits for it to settle toward OCV, looks up the corresponding SOC, and uses that as a calibration point.
The chemistry that everyone calls safe and boring turns out to be genuinely difficult to monitor accurately. Not dangerous. Difficult. The failure mode is not fire. The failure mode is showing the driver 250km of range and running out of power 180km later.
This works when the voltage changes meaningfully with SOC. If 10% SOC change produces 50mV voltage change, and your measurement system has ±3mV accuracy, you can resolve SOC to roughly ±0.6% from voltage alone. That is useful information.
If 30% SOC change produces 30mV voltage change, and your measurement accuracy is still ±3mV, the uncertainty band spans ±3% SOC just from measurement noise. And that assumes perfect OCV, which requires rest periods that may not be available. Under load the terminal voltage deviates from OCV by an amount depending on current, temperature, and internal resistance. The information content of voltage measurements in the flat region approaches zero.
Zhang and colleagues at Tsinghua University published work in 2023 explicitly addressing this. Their paper on pseudo-open-circuit voltage modeling for LFP stated directly that the flatness of the OCV curve makes traditional voltage-based SOC estimation ineffective. The flat region has low observability. Voltage feedback cannot correct estimation errors because voltage does not respond to SOC changes.
The UC Berkeley group under Scott Moura has been working on LFP estimation for years. Their research documented that adding 30mV of voltage offset noise at 40% SOC could generate SOC errors exceeding 10%. The flat curve amplifies small measurement errors into large state estimation errors. This is not a failure of the algorithm. It is a fundamental information-theoretic limitation. You cannot extract information that is not present in the signal.
A paper from a Belgian research group in 2024 tested three different Kalman filter variants on LFP batteries in a frequency containment reserve application. Extended Kalman filter. Dual unscented Kalman filter. Particle filter. They used a model-in-the-loop toolchain with a 48-hour simulated load profile. Under these controlled conditions, EKF showed 4% error, DUKF achieved 1.1% error, and particle filter performance varied depending on configuration.
These numbers sound reasonable until you consider what "controlled conditions" means. Known battery model. Known initial SOC. Stable temperature. Fresh cells. The algorithms were validated against simulation, not against field data from aging batteries with unknown history operating across temperature extremes.
Coulomb Counting
The fallback when voltage-based estimation fails is coulomb counting. The principle is simple. Measure the current flowing into and out of the battery. Integrate over time. The integral gives you the change in stored charge. If you knew the SOC at some reference point and you perfectly tracked every amp-second since then, you would know the current SOC exactly.
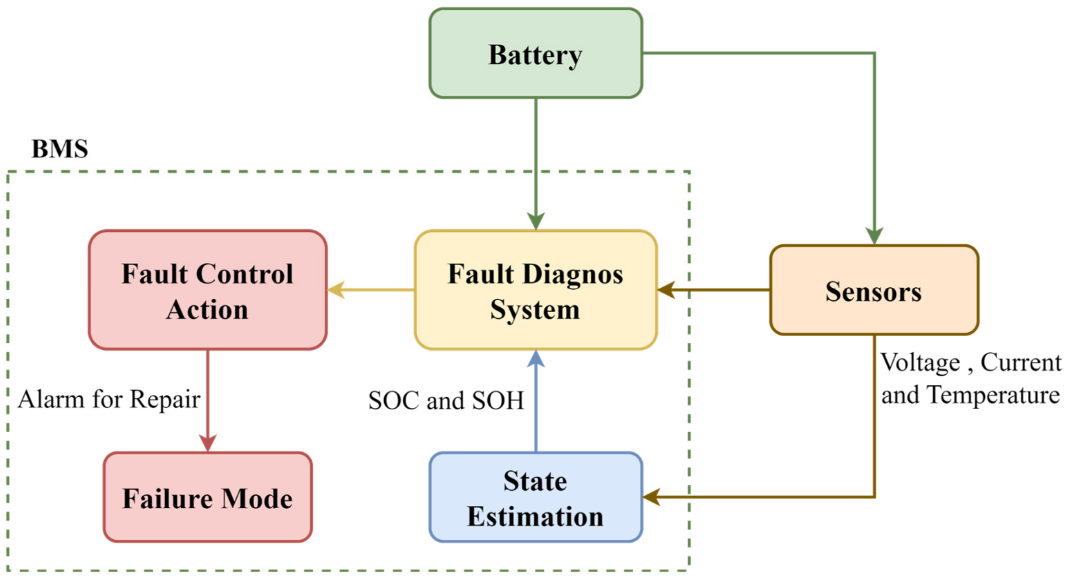
Battery management systems must integrate multiple sensing modalities for accurate state estimation
Current sensors have offset errors. A Hall effect sensor or a shunt resistor amplifier might read 50mA or 100mA when the true current is zero. This offset gets integrated into the running SOC total continuously. At 1Hz sampling, a 50mA offset accumulates to 180 coulombs per hour. On a 100Ah cell that is 0.05% SOC drift per hour, or about 1.2% per day, just from sensor offset. Over two weeks that is nearly 17%.
Real sensors have offsets that vary with temperature and age. The offset at 0°C differs from the offset at 40°C. The offset after three years differs from the offset when new. The BMS can try to calibrate out these offsets but the calibration itself has uncertainty.
Self-discharge removes charge from the cell without passing through the current sensor. The ions migrate internally through parasitic reactions. The capacity decreases. The coulomb counter does not see it. Self-discharge rates for lithium batteries typically run 2-5% per month depending on temperature and SOC. The coulomb counter will systematically overestimate SOC by this amount over time.
Coulombic efficiency during charging is not exactly 100%. Some fraction of the charge that enters the cell gets consumed by side reactions rather than stored as intercalated lithium. The SEI layer grows. Electrolyte decomposes slightly. The efficiency might be 99.5% or 99.8% depending on conditions. If the algorithm assumes 100% efficiency and the true value is 99.5%, that is another 0.5% per full cycle that accumulates as error.
All of these error sources accumulate monotonically until something resets the estimate. After two weeks of normal operation without a calibration event, coulomb counting can drift 10-15% from reality. I have seen claims of worse in some papers examining field data.
The Calibration Problem
The reset mechanism uses the voltage curve endpoints. Near 0% and near 100% SOC, the LFP voltage curve finally develops meaningful slope. The BMS can compare a voltage-based SOC estimate against the coulomb-counted estimate and correct the accumulated drift.
This creates a dependency on user behavior that is not obvious until you think about it.
Key Insight
Standard advice for maximizing lithium battery cycle life is to avoid the extremes of the SOC range. Do not charge to 100%. Do not discharge to 0%. Keep the battery in the middle, say 20% to 80%, or even 30% to 70% for maximum longevity. This advice is correct for cycle life. It is catastrophic for SOC accuracy on LFP.
A user who follows this advice will never give the BMS a calibration opportunity. The voltage-based correction requires observing the battery at points where voltage actually indicates SOC. If the user never goes there, the coulomb counting drift accumulates indefinitely.
After months of use, the displayed SOC might diverge substantially from reality. The user will not know until they push into the uncalibrated region and discover that the range remaining is not what the display claimed. Or until they try to access the full capacity for a long trip and find less than expected.
Some BMS implementations try to work around this by opportunistic calibration during rest periods. If the battery sits unused for long enough, the terminal voltage will settle toward OCV, and the BMS can attempt a voltage-based correction even in the middle of the SOC range. The problem is that LFP cells have unusually long relaxation times.
Research has documented that for LFP cells, a discrepancy between the measured voltage and the equilibrium OCV can persist even after 48 hours of rest. The voltage keeps drifting toward equilibrium over days. In a vehicle that gets used every day or two, the battery never reaches equilibrium. The opportunistic calibration window never opens.
Temperature Effects
Cold weather compounds all of the above.
Internal resistance in lithium batteries increases substantially at low temperature. For LFP the resistance roughly doubles between 25°C and 0°C. The exact factor depends on cell design and SOC but the magnitude is consistent.
Under load, this elevated resistance causes the terminal voltage to sag below OCV by an amount proportional to current times resistance. At 0°C with 2x normal resistance, the voltage depression under load is 2x larger than at 25°C. The BMS, if it is using any voltage information at all, will interpret this depressed voltage as lower SOC than reality.
A pack at 80% true SOC might show voltage readings consistent with 60% SOC under moderate discharge current at 0°C. The driver sees the range estimate drop precipitously as temperature falls. Part of this is real capacity reduction from cold (the discharge capacity is genuinely lower at low temperature). Part of it is estimation error from the voltage depression being misinterpreted.
The BMS must incorporate temperature-dependent compensation to avoid being fooled. But the compensation models are imperfect. They are calibrated at specific temperatures and interpolated between. The actual resistance-temperature relationship is nonlinear and depends on SOC and aging state. Any model mismatch gets amplified by the flat voltage curve, which provides no feedback to correct errors.
The UC Berkeley group's work explicitly listed low temperatures as a scenario where existing LFP estimation methods struggle. The combination of high internal resistance, voltage depression under load, and the flat OCV curve creates a particularly difficult estimation environment.
Drivers in cold climates discover this as unexpected range reduction. The car displayed 300km range when they left home. Fifty kilometers later it displays 180km. The reality did not change that fast. The estimate was wrong and got corrected as the BMS accumulated more information under real operating conditions.
The Algorithm Literature
Academic literature on LFP SOC estimation has exploded over the past decade. The problem is well recognized in the research community. The solutions are partial.
Kalman filters in various forms. Extended Kalman filter linearizes the battery model around the current operating point and uses the linearized system for state estimation. Works reasonably well when the model is accurate and the operating point does not change too fast. Achieves maybe 4% SOC error under favorable conditions.
Unscented Kalman filter avoids linearization by using sigma points to propagate uncertainty through the nonlinear model directly. Better accuracy than EKF, maybe 2% error under favorable conditions, but higher computational cost. Still depends on model accuracy.
Particle filters represent the state distribution as a collection of weighted samples. Can handle arbitrary nonlinearity and non-Gaussian noise. Computationally expensive. Performance varies a lot depending on implementation details and the number of particles.
Adaptive filters that adjust their parameters online to track changing battery characteristics. Dual Kalman filters that estimate both state and parameters simultaneously. H-infinity filters that provide robustness guarantees against model uncertainty. Sliding mode observers. Moving horizon estimators.
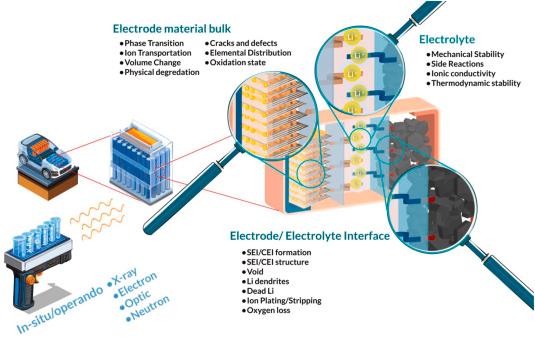
Advanced laboratory equipment enables detailed characterization of battery behavior across operating conditions
Neural networks. LSTM networks trained on laboratory data to learn the mapping from voltage, current, and temperature sequences to SOC. Can achieve very low error on data similar to the training set. Generalization to different cells, temperatures, and aging conditions is questionable.
Electrochemical impedance spectroscopy. Apply small AC perturbations across a range of frequencies. Measure the complex impedance response. Different electrochemical processes dominate at different frequencies. The impedance spectrum contains information about charge transfer resistance, diffusion, and SEI layer properties that DC measurements cannot access.
A 2025 paper proposed using impedance timescale information for LFP SOC estimation. Features extracted across timescales from 10^-5 seconds to hundreds of seconds. Better performance than voltage-based methods in the plateau region. But EIS requires hardware that most production BMS systems do not include. Signal generators, precision measurement circuits, frequency analysis. The technique remains largely confined to laboratory characterization and high-end stationary storage with dedicated monitoring systems.
All of these methods help. None of them solve the fundamental problem that the voltage curve is flat. You can fuse information more optimally. You can build better models. You can throw machine learning at it. The information deficit remains. The flat region has low observability by definition.
Field Data Reality
Everything I have described so far draws primarily on laboratory studies and simulation results. Field performance is different.
A paper published in Joule in August 2023 used field battery pack data collected over one year of actual vehicle operation. The researchers extracted performance indicators from BMS signals during normal driving and charging events. They noted explicitly that laboratory data could fail to accurately reflect real-world field data.
In laboratory settings, batteries cycle under predefined loads in temperature-controlled environments. Every cycle is the same. The temperature is constant. The current profile is known. The initial conditions are controlled.
Real driving involves partial charging, partial discharging, varying ambient temperatures, long parking periods in hot sun or freezing cold, aggressive acceleration, gentle cruising, regenerative braking, fast charging, slow charging, and every possible combination of these. The battery never reaches the steady-state conditions that laboratory tests assume.
That phrase keeps appearing in the literature. Limited by volume and quality of field data. The algorithms are developed on laboratory data, validated on laboratory data, published based on laboratory data. Then they get deployed in real vehicles and the performance is different.
The Joule paper proposed using impedance-based performance indicators that could be extracted during normal operation. Resistance during acceleration events. Resistance during braking events. Charging impedance. These indicators showed strong correlation with temperature variation across seasons. The researchers found it challenging to uniquely attribute whether changes in performance indicators stemmed from specific degradation mechanisms versus ambient temperature variation.
A paper in Nature Communications from January 2025 analyzed operational data from 300 diverse EVs over three years. The stated goal was understanding the disparities between field data and laboratory battery test data and their effect on SOH estimation. The researchers noted that limited studies had focused on SOH estimation for operating EVs under diverse random driving conditions. Previous studies were limited by volume and quality of field data. The model performance of existing methods was restricted by single-modal input.
That phrase keeps appearing in the literature. Limited by volume and quality of field data. The algorithms are developed on laboratory data, validated on laboratory data, published based on laboratory data. Then they get deployed in real vehicles and the performance is different.
Another paper, published in Applied Energy in 2016, reported struggling to collect real-world datasets for more than a year across four ambient temperatures using extensive driving profiles. The authors described this as the first effort to estimate SOH using extensive driving profiles to consider EV environments in a more practical way. Their framework achieved average error less than 2.18% across all settings.
That 2.18% number represents a validated research framework tested under controlled conditions with known ground truth. It does not represent what a production BMS achieves over a 10-year vehicle life with commodity sensors and no ground truth available.
State of Health
SOH estimation is technically harder than SOC estimation. SOC varies continuously during operation and can be calibrated periodically. SOH changes slowly over months and years and cannot be directly measured without destructive testing.
Capacity fade results from multiple mechanisms. Loss of cyclable lithium as it gets trapped in the SEI layer or plates irreversibly on the anode. Degradation of cathode active material through structural changes and dissolution. Degradation of anode active material. Loss of electrical connectivity within the electrodes as binder degrades and particles crack. Electrolyte decomposition consuming lithium and generating gas.
These mechanisms proceed at different rates under different conditions. High temperature accelerates most of them. High SOC accelerates cathode degradation. High current accelerates lithium plating on the anode. Calendar aging proceeds even when the battery sits unused.
The mechanisms interact nonlinearly. The rate of SEI growth depends on the SEI thickness already present. Lithium plating creates sites that accelerate further plating. Cracked particles expose fresh surface area for side reactions.
Predicting future degradation requires models that capture all of the relevant mechanisms and their interactions. Physics-based models built from electrochemical first principles can achieve good accuracy but require detailed parameterization for each specific cell design. The parameters change as the cell ages. The models need updating.
Empirical models fitted to aging test data are simpler but may not extrapolate reliably to conditions outside the test matrix. A model trained on cycling at 25°C may fail at 45°C. A model trained on 1C rates may fail at 3C.
Warranty thresholds typically specify replacement when capacity falls below 70% or 80% of rated. Because degradation prediction is uncertain, manufacturers set thresholds conservatively. Many batteries reach warranty limits with substantially more remaining useful capacity. Some studies have suggested that 20-30% of batteries replaced under warranty have significant life remaining.
A digital twin study documented systematic discrepancy of roughly 4% between BMS-reported SOH and independently measured values. That gap affects scheduling decisions for grid storage operators who need to know actual available capacity. It affects warranty claim adjudication. It affects residual value estimation for used vehicles.
High-Nickel: A Different Problem
I said at the beginning that I wanted to focus on LFP because I think its monitoring challenges are underappreciated. But high-nickel deserves attention too, even if the story is more familiar.
NCA thermal runaway onset sits around 150°C. NMC 811 is somewhat higher, maybe 210°C, but still low by lithium battery standards. Once runaway begins, the high energy density that makes these chemistries attractive becomes a liability. The total energy release is large. The reaction is fast. Fires propagate between cells in seconds if not contained.
High-nickel battery systems demand sophisticated thermal management and rapid protection response
Elon Musk commented publicly in September 2021 that the 46mm diameter 4680 cell was a huge challenge for propagation resistance even with the steel shell. Tesla has more production experience with high-nickel cylindrical cells than arguably any other company. When they describe something as a huge challenge, that indicates the difficulty is real.
The thermal management literature confirms this. A paper published in 2025 on 4680 thermal management explained that the larger diameter creates a smaller surface-to-volume ratio which exacerbates thermal gradients within the cell. Heat generated throughout the volume must conduct radially to the surface for removal by the cooling system. The conduction path is longer in a larger cell. The gradient is steeper.
The BMS can only measure surface temperature. Thermistors or thermocouples contact the cell case or the busbar. They measure what they touch. Core temperature must be inferred through thermal models that predict how heat flows from the interior to the surface based on known thermal conductivity and geometry.
These models become less accurate as the gradient steepens. The core-to-surface temperature difference at high discharge rates in a 46mm cell significantly exceeds the difference in an 18mm cell under the same conditions. A model calibrated at low rates may underestimate core temperature at high rates. A model calibrated at 25°C ambient may fail at -10°C when the thermal properties change.
If the model underestimates core temperature, the BMS may permit operation that stresses the cell beyond safe limits. If it overestimates, the BMS will unnecessarily derate performance. Getting the model right matters.
Tesla's BMS maintains cell-to-cell voltage differences within 10mV tolerances. Temperature control within 3°C across the pack. Thousands of sensor measurements per second. The system must operate reliably over a 10-15 year vehicle lifespan under varying environmental conditions.
Dual MCU architectures have become standard. The primary processor handles normal BMS functions. A secondary processor does nothing except monitor the primary for anomalous behavior. If the primary stops responding, issues invalid commands, or exhibits any fault signature, the secondary triggers immediate disconnect through an independent hardware path.
Critical Safety Response
The protection response must complete within microseconds. Short circuit currents can reach hundreds or thousands of amps. The energy delivered before disconnect scales linearly with response time. A 100 microsecond response at 1000A delivers 0.1 coulombs. A 1 millisecond response delivers 1 coulomb. The thermal damage scales accordingly.
This response time excludes software from the critical path. A microcontroller running at typical frequencies cannot reliably sample, process, and act within 100 microseconds while handling other tasks. The protection circuit uses analog comparators that trigger directly from the measurement signal without processor intervention. The disconnect happens in hardware. Software learns about it afterward.
But here is the point I keep coming back to. The voltage curve cooperates.
NCA and NMC 811 have monotonic OCV-SOC relationships across most of the operating range. Voltage goes up as SOC goes up. Voltage goes down as SOC goes down. The relationship has slope. The slope contains information.
Standard voltage-based SOC estimation works on high-nickel cells the way it works on other chemistries with reasonable voltage curves. Coulomb counting provides continuous tracking. Voltage readings provide calibration. Kalman filters fuse the information sources. The algorithms achieve the accuracy they are designed to achieve.
The monitoring complexity is high. The system requirements are demanding. But the problem is tractable. You know what you need to measure and the measurements contain the information you need.
GB 38031-2025
China released a new mandatory national battery safety standard on March 28, 2025. The designation is GB 38031-2025. It takes effect July 1, 2026.
The significant change concerns thermal propagation. The previous standard required batteries to provide warning signals before fire or explosion during thermal runaway. The new standard prohibits fire and explosion outright. If a cell goes into thermal runaway, the pack must contain it without igniting and without exploding. Any smoke emitted must not reach the passenger compartment.
This is a stricter requirement than current European or North American standards. It forces pack designers to detect thermal events earlier and intervene faster than previous requirements demanded.
CATL announced in April 2025 that their Qilin battery passed GB 38031-2025 certification. The China Automotive Technology and Research Center issued the test report. CATL was first to achieve compliance.
The Qilin battery places liquid cooling plates between adjacent cells rather than around them. This increases heat transfer area by four times compared to conventional designs. If one cell enters thermal runaway, the cooling plates between it and its neighbors absorb and conduct away the heat before it can propagate. The design includes an integrated elastic layer with thermal insulation properties.
CATL claims over 18 million vehicles worldwide carry their batteries as of early 2025. The Qilin architecture specifically has been adopted by Zeekr, Li Auto, Xiaomi, Aito, Neta, Avatr, Lotus, and others.
No other battery manufacturer has publicly announced passing GB 38031-2025 certification. The deadline is about 14 months away. Meeting the standard requires either matching CATL's level of thermal design sophistication or developing equivalent alternative approaches.
The monitoring implications are significant. Detecting thermal runaway early enough to prevent propagation requires sensing modalities beyond simple temperature threshold monitoring. Rate of temperature rise. Potentially gas sensing for the hydrogen and carbon monoxide that appear during early-stage electrolyte decomposition before temperature spikes become dramatic. Possibly acoustic signatures that precede visible thermal events.
The BMS becomes not just a monitor but a safety system subject to functional safety requirements. ASIL D certification. Redundant sensing. Diagnostic coverage analysis. Documented failure modes.
Format Effects
Cell format influences monitoring architecture in ways that cut across chemistry.
Cylindrical cells in the 18650 format dominated early EV production. A large pack might contain 6000 or 7000 cells. Each cell requires voltage monitoring. The wiring harness connecting all those measurement points to the BMS electronics adds weight and cost and creates potential failure modes at every connection.
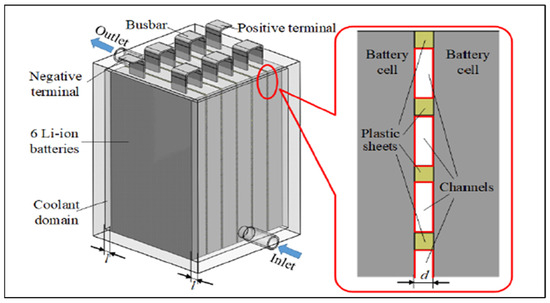
Different cell formats present unique monitoring challenges and architectural trade-offs
The 21700 format increased capacity per cell by roughly 50%, reducing cell count proportionally for a given pack energy. The 4680 format contains roughly five times the energy of an 18650. A pack that would have required 7000 18650 cells might require 1400 4680 cells. Fewer cells means fewer monitoring channels, simpler wiring, lower component cost in the BMS.
But larger cylindrical cells create thermal challenges. The surface-to-volume ratio decreases as diameter increases. Heat generated throughout the cell volume must conduct to the surface. The path length increases. The thermal gradient steepens.
The tabless electrode design that Tesla and others have adopted helps with this. Traditional cylindrical cells have discrete tabs connecting the current collectors to the external terminals. Current crowds at the tabs, creating hot spots. The tabless design distributes current collection across the entire electrode surface. More uniform current distribution means more uniform heat generation.
The tabless approach reduces peak temperatures. It does not eliminate the core-to-surface gradient. The BMS still cannot measure core temperature directly. The thermal model still has uncertainty.
An engineering analysis published shortly after Tesla's Battery Day presentation suggested that the traditional cooling snake approach used in Model 3 and Model Y would not provide sufficient heat transfer for 4680 cells. The cooling had to move from the sides of the cells to the top and bottom surfaces.
Pouch cells present different challenges. The flexible laminate packaging that enables high packaging efficiency cannot constrain internal pressure. Gas generated by side reactions causes the cell to swell. Swelling force increases with cycling and aging.
The swelling correlates with state of health. Capacity fade and resistance growth manifest partly as volume expansion from SEI layer thickening, lithium inventory loss, and gas generation. Measuring the swelling provides diagnostic information independent of electrical parameters.
Piezoresistive force sensors can detect thickness changes with sub-10-micron resolution. Pressure sensors can track swelling force. The technology exists. Most manufacturers do not use it.
The reasons are practical. Vibration noise from the vehicle contaminates the mechanical measurements. The sensors add cost and complexity. The correlation between swelling and SOH, while real, is not precise enough to replace electrical diagnostics entirely.
The consequence is reduced visibility into mechanical degradation. Pouch cells that develop excessive swelling may approach failure without the BMS detecting anything abnormal until the laminate seal compromises and the cell vents or shorts.
Prismatic cells in aluminum housings dominate Chinese EV production. Individual cell capacities reach 100-200Ah, drastically reducing cell count. The rigid housing can contain internal pressure, at least up to a point.
The large flat surfaces of prismatic cells allow efficient heat transfer to cooling plates but require distributed temperature sensing. A single thermistor cannot characterize conditions across a cell surface that spans 200mm. Temperature gradients develop across the electrode stack under high-rate operation. Multiple sensors per cell are common.
Data and Competitive Dynamics
CATL operates the largest connected battery fleet in the world. Over 18 million vehicles as of early 2025, with real-time data flowing back through cellular connections to cloud infrastructure.
This data trains machine learning models. The algorithms learn patterns of degradation, patterns of usage, patterns of failure. They learn to predict which cells will develop problems before the problems become visible to simpler diagnostics. They learn to optimize charging strategies for longevity and performance.
Machine learning performance scales with data volume. An algorithm trained on 18 million vehicles will, everything else being equal, outperform an algorithm trained on 1 million vehicles. The larger training set captures more edge cases, more operating conditions, more failure modes.
This creates a competitive dynamic that may prove more durable than advantages in cell chemistry. The manufacturer with the largest connected fleet accumulates training data that improves algorithms across all their products. The improved algorithms provide better user experience and lower warranty costs, strengthening market position, which generates more data.
New entrants face not just the challenge of producing competitive cells. They face the challenge of producing competitive monitoring intelligence. And the monitoring intelligence requires data that new entrants do not have and cannot easily acquire.
ADI developed a wireless BMS used in GM's Ultium platform. Texas Instruments has achieved ASIL-D certification for wireless BMS solutions supporting networks of 100 nodes with latency under 2 milliseconds. Wireless eliminates up to 90% of pack wiring and frees roughly 15% of pack volume for additional cells.
The wireless technology is mature enough for production deployment. The challenge is reliable communication inside a metal enclosure with electromagnetic interference from power electronics. Multipath propagation, signal attenuation, noise. The communication protocol must handle packet loss gracefully. The safety architecture must ensure that communication failures cannot disable protective functions.
I have written a lot about monitoring challenges and relatively little about monitoring successes. That probably gives a misleading impression of the field. Production BMS systems work well enough to support millions of EVs in daily operation. Range estimates are usually approximately correct. Batteries rarely fail catastrophically. The technology is mature.
But "well enough" and "approximately correct" hide real limitations that the industry does not always acknowledge. The 3% SOC accuracy claimed in spec sheets represents lab conditions with fresh cells. Field accuracy after years of use across temperature extremes is worse. The warranty claims and the range complaints and the occasional unexpected failures trace back, at least partly, to monitoring limitations that the user never sees directly.
Every lithium battery needs monitoring. The safe chemistry is algorithmically difficult. The dangerous chemistry is thermally demanding. The easy chemistry sits in the middle and dominates volume production partly for that reason. Data from connected fleets is becoming a competitive asset that may matter more than cell technology alone.
CATL meeting GB 38031-2025 ahead of schedule forces everyone else to match or fall behind in the largest EV market. The standard is strict. The monitoring implications are significant.