
Batteries First
Start with storage because that is where most systems fail. Solar panels last 25 years with minimal degradation. Batteries are the weak link.
Lithium-ion batteries dominate solar storage. 90-95% round-trip efficiency, 3,000-10,000 cycle life, costs now below $140/kWh at pack level. The working principle relies on intercalation: lithium ions shuttle between layered host structures at each electrode without fundamentally altering the crystal framework.
During charging, external voltage drives lithium ions from cathode through electrolyte into anode. Graphite anodes accommodate one lithium per six carbons, yielding 372 mAh/g theoretical capacity. The graphite layers expand about 10% during lithiation. Manageable stress that enables thousands of cycles without structural failure.
The cathode determines most performance characteristics.
Lithium iron phosphate from the Goodenough group at UT Austin offers exceptional stability: 5,000+ cycles to 80% capacity, no cobalt, minimal fire risk. The 3.4 V operating voltage and 170 mAh/g capacity limit energy density to 120-160 Wh/kg. BYD's Blade Battery uses LFP and dominates Chinese energy storage installations where weight matters less than longevity.
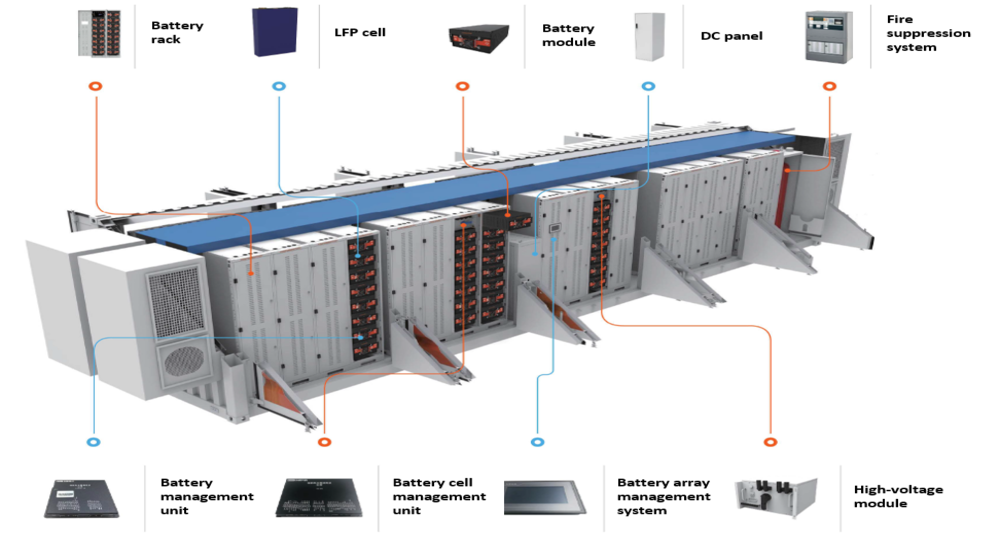
Lithium-ion battery modules form the backbone of modern energy storage systems
Nickel-rich layered oxides push energy density to 250-280 Wh/kg through higher operating voltage and greater capacity. Panasonic, Samsung SDI, CATL have developed variants with different nickel-manganese-cobalt ratios. The early cells used equal parts of all three metals. Current versions run 80% nickel, 10% manganese, 10% cobalt. High delithiation triggers layered-to-spinel phase transitions at particle surfaces, growing resistive layers that cause capacity fade. Oxygen release at elevated temperatures creates thermal runaway risk. Tesla's Megapack uses NMC chemistry despite the added complexity of keeping cells at safe temperatures.
The solid-electrolyte interphase forms during first charge when electrolyte decomposes on the graphite surface. This 10-50 nm layer consumes about 10% of initial lithium inventory but then passivates the surface, blocking further decomposition while allowing lithium transport. SEI stability determines calendar life. A cell that sits unused for five years may lose 15% of capacity just from SEI growth. Jeff Dahn's group at Dalhousie University has published extensively on electrolyte additives that form more stable SEI layers, extending usable life significantly.
Silicon anodes offer 3,579 mAh/g theoretical capacity. Nearly ten times graphite. Silicon expands 300% during lithiation. Particles fracture, SEI cracks and reforms repeatedly consuming lithium, capacity fades within tens of cycles. The volume change breaks everything.
Commercial cells incorporate 3-10% silicon in graphite composites to capture some benefit while limiting damage. Sila Nanotechnologies and Amprius have demonstrated higher silicon content with engineered particle architectures. Cost and cycle life remain challenging for mainstream applications.
Battery conferences have featured silicon anode talks for fifteen years. Progress happens slowly. The gap between a working lab cell and a product that survives ten years in a customer's garage remains wide. The theoretical numbers look attractive. The engineering has not caught up.
Standard electrolytes use lithium hexafluorophosphate salt in ethylene carbonate and dimethyl carbonate mixtures. Flammable. Decompose above 4.3 V versus lithium, limiting cathode voltage. Localized high-concentration electrolytes from PNNL and Argonne use fluorinated solvents to create stable operation windows exceeding 4.5 V. Commercial adoption limited by cost and viscosity. Ionic liquid electrolytes eliminate flammability but have high viscosity and cost.
Separators are 12-25 micrometers of polyethylene or polypropylene with 40-50% porosity. Thin enough to minimize resistance. Porous enough for ion transport. Ceramic coatings improve thermal stability and prevent shrinkage if temperatures rise.
Degradation
Loss of lithium inventory dominates most aging scenarios. Every SEI reformation event consumes cyclable lithium. Storage at high state-of-charge accelerates SEI growth because lower anode potential increases decomposition driving force. Calendar aging at 45°C and 100% SOC can consume 20% of capacity within two years even without cycling. NREL recommends storage at 30-50% SOC and below 25°C for maximum life.

Advanced testing reveals degradation patterns in battery cells

Thermal management systems protect cells from extreme conditions
Loss of active material occurs through particle cracking, binder decomposition, electrical isolation. Nickel-rich cathodes suffer surface reconstruction that blocks lithium access. Post-mortem analysis of failed cells shows this clearly under electron microscopy.
Lithium plating occurs when lithium deposits as metal on the anode surface rather than intercalating into graphite. Low temperatures increase plating risk because diffusion slows while charge transfer remains fast. The lithium arrives at the surface faster than it can move into the graphite layers. Dendrites from repeated plating can penetrate separators and cause internal shorts. BMS systems limit charge rate at low temperatures specifically to avoid this failure mode.
Temperature effects follow Arrhenius kinetics. Degradation rate roughly doubles for every 10°C increase. A cell at 35°C ages twice as fast as one at 25°C. In desert installations, ambient temperatures can exceed 45°C. Tesla's Megapack uses liquid cooling to maintain cells within 20-35°C regardless of ambient conditions. The cooling system adds cost and consumes power but extends usable life from perhaps 8 years to 15 or more.
Cycle depth matters. Shallow cycling between 10-90% SOC causes far less degradation per kWh throughput than deep cycling. A cell cycled 10% daily might last 15,000 equivalent full cycles. Same cell cycled 100% daily might last 3,000. The relationship is not linear. Grid storage operators exploit this by oversizing capacity and operating within constrained windows. A 100 MWh installation might routinely use only 80 MWh to extend calendar life.
The degradation math gets complicated. Temperature, SOC, cycle depth, charge rate, calendar time all interact through mechanisms that reinforce each other. Models exist but require calibration data that takes years to collect. Most project developers use simplified assumptions and hope the batteries outperform predictions. The Hornsdale installation has degraded less than expected. Other projects have disappointed.
How Photovoltaics Work
Now the generation side.
Sunlight consists of photons. Each photon carries energy proportional to its frequency. Red photons at 700 nm carry about 1.77 eV; blue photons at 450 nm carry 2.76 eV. The solar spectrum peaks around 1.8 eV.
When photons hit silicon, absorption depends on the band gap. Silicon's band gap sits at 1.12 eV. Photons below this energy pass straight through—the material is transparent to them. Photons above it get absorbed, exciting electrons from valence band to conduction band and leaving holes behind.
A 3 eV photon hitting silicon still produces only a 1.12 eV electron-hole pair. The remaining 1.88 eV becomes heat within femtoseconds through phonon emission. The crystal lattice absorbs excess energy faster than any extraction scheme could capture it. Martin Green at UNSW has spent decades optimizing silicon cells. Thermalization remains the single largest loss mechanism even in his record-breaking PERC cells. No trick fixes this. The energy goes into crystal vibrations before anyone can grab it.
The PN junction separates these electron-hole pairs before they recombine. When p-type silicon meets n-type silicon, carriers diffuse across the boundary. P-type material contains boron dopants that create an excess of holes. N-type contains phosphorus dopants that provide extra electrons. This diffusion leaves behind fixed ionized dopants, creating an electric field of 0.6-0.9 V pointing from n-side to p-side.
Photogenerated carriers near this junction get swept apart by the field. Electrons accumulate in the n-region; holes in the p-region. Connect the two sides with a wire, current flows.
Collection competes with recombination. Shockley-Read-Hall recombination occurs through crystal defects. Every impurity atom, vacancy, or dislocation provides a stepping stone for electrons to drop back to the valence band. This dominated early silicon cells. Czochralski crystal growth, zone refining, and gettering processes developed at Bell Labs and Siemens reduced defect densities by orders of magnitude. Took decades of incremental work to get defects low enough for high efficiency.
Auger recombination involves three carriers and scales with the cube of carrier concentration. Under normal one-sun illumination, Auger stays small enough to ignore. Increase concentration to 500 suns, it becomes dominant. Concentrator cells from Fraunhofer ISE must balance concentration ratio against this ceiling. Cannot just keep adding mirrors indefinitely.
Surface recombination happens at crystal boundaries where dangling bonds trap carriers. A bare silicon surface has roughly 10^15 recombination centers per square centimeter. Enormous loss. Thermal oxide passivation, developed at Stanford in the 1970s, cut this by three orders of magnitude. A thin layer of glass-like silicon dioxide ties up the dangling bonds. Atomic layer deposition of Al2O3, pioneered at Eindhoven University of Technology, pushed surface recombination velocities below 2 cm/s. Modern cells would be useless without these passivation layers.
Silicon wafer processing requires extreme precision to achieve high conversion efficiency
The minority carrier diffusion length integrates all these effects into one number: how far can a carrier travel before recombining? In 1954, the first Bell Labs silicon cell had diffusion lengths around 50 micrometers and achieved 6% efficiency. Modern PERC cells exceed 1 millimeter. That improvement accounts for most of the efficiency gain from 6% to 26% over seven decades.
Shockley and Queisser calculated the theoretical maximum in 1961: 33.7% for a single junction under one sun, optimized at 1.34 eV band gap. Silicon at 1.12 eV has a limit around 29.4%. The current record stands at 26.7% for a heterojunction cell from Kaneka Corporation, achieved in 2017. The gap between 26.7% and 29.4% represents losses from series resistance, optical reflection, remaining recombination that decades of work have failed to eliminate.
Trapping More Light
Silicon absorbs weakly near its band edge. Complete absorption of 1100 nm light requires 200+ micrometers of material. Thicker wafers cost more and increase the distance carriers must travel. Both bad.
Random pyramid texturing bends incoming light to oblique angles. Anisotropic KOH etching creates the pyramids by preferentially attacking certain crystal planes. Light hitting at 45 degrees travels 1.4x the wafer thickness. Total internal reflection can trap light for multiple passes, bouncing photons back and forth until absorption occurs.
Yablonovitch at Bell Labs calculated the theoretical limit in 1982: 4n² path length enhancement for randomized texturing. For silicon with n≈3.5, that means 50x enhancement possible. Actual cells achieve 70-90% of this. The gap comes from imperfect randomization and absorption in the back reflector.
Wafer thickness has dropped from 300+ micrometers in the 2000s to 150-170 micrometers today. Diamond wire sawing replaced slurry-based cutting around 2015. The wires can cut thinner with less material wasted to sawdust. The push continues toward 100-micrometer wafers. Handling fragility becomes problematic at that thickness. Wafers break.
Cell Types
Kaneka deposits thin amorphous silicon layers on both sides of a crystalline silicon wafer. The amorphous layers provide field-effect passivation, repelling minority carriers from the surface. Contact is made through transparent conductive oxides rather than metal directly touching silicon. Open-circuit voltage exceeds 740 mV, compared to 680-700 mV for conventional cells. That 40-60 mV difference translates directly to efficiency because power equals current times voltage.
SunPower took a different approach. All metal contacts move to the rear surface, eliminating front-side shading losses entirely. The front becomes a pure optical surface. IBC cells held efficiency records through the 2010s before heterojunction technology caught up. Manufacturing complexity limits IBC to premium applications where the extra efficiency justifies higher cost.
Tunnel oxide passivated contact cells represent the current manufacturing ramp. A thin silicon oxide layer of 1-2 nm topped with doped polysilicon provides both passivation and carrier selectivity. TOPCon achieves 25-26% efficiency with process steps compatible with existing PERC lines. LONGi announced plans to convert most production to TOPCon by 2025.
Anyone following solar news sees record efficiency announcements every few months. Most matter less than the press releases suggest. A 0.1% improvement in a research cell rarely translates to commercial products. PERC took a decade to move from lab to mainstream production.
Connecting It Together
Raw photovoltaic output cannot charge batteries directly. Voltages fluctuate with irradiance and temperature. A cloud passing overhead drops voltage immediately.

Power electronics manage the conversion between solar panels, batteries, and the electrical grid
Maximum power point tracking adjusts load impedance to extract peak power under varying conditions. Perturb-and-observe steps voltage up or down and checks if power increased. Simple but works. Incremental conductance uses the mathematical condition dP/dV = 0 to converge without oscillation around the peak. Under partial shading, multiple local maxima appear on the power-voltage curve. Global MPPT algorithms scan the full voltage range periodically to find the true maximum.
DC-DC converters transform voltages between array, battery, and load. Buck converters step down; boost converters step up. Switching frequencies of 50-200 kHz enable compact magnetics. Silicon carbide MOSFETs from Wolfspeed and Infineon have pushed converter efficiency above 99% by reducing switching losses compared to silicon IGBTs.
Grid-tied systems require inversion to 50/60 Hz AC. Phase-locked loops synchronize output with grid voltage. Anti-islanding protection disconnects within 2 seconds when grid power fails. Protects utility workers from energized lines they expect to be dead.
Battery management systems monitor voltage, temperature, current on every cell. State-of-charge estimation combines coulomb counting with voltage-based correction. Cell balancing addresses manufacturing variation by equalizing charge levels across series strings. Passive balancing dissipates excess as heat. Active balancing shuttles charge between cells for higher efficiency.
Thermal management integrates with BMS. Temperature sensors distributed throughout the pack feed control algorithms that adjust cooling fan speed, pump flow rate, or heating element power. Preconditioning before fast charge warms cells from cold-soak conditions to optimal temperature range. Reduces plating risk.
Efficiency compounds through the chain: 20% PV × 98% MPPT × 90% battery × 97% inversion = 17% from sunlight to delivered AC. Sounds low until recognizing the fuel costs nothing.
Lithium-ion dominates 2-4 hour storage. Beyond 8 hours, flow batteries offer lower energy cost through tank scaling.
Where It Stands
Silicon photovoltaics have matured. Module costs below $0.20/W leave little room for further reduction. Efficiency gains above 26% require significant effort for incremental improvement.
Perovskite-silicon tandems have demonstrated 33% efficiency in labs. A 1.7 eV perovskite top cell absorbs blue and green light at high voltage while transmitting red and infrared to silicon below. Perovskites degrade through ion migration, moisture ingress, photodecomposition. Accelerated testing suggests 20-year lifetimes may be achievable with proper encapsulation. Field data limited to a few years. Oxford PV keeps announcing production timelines that slip. The skeptics have a point. But silicon took decades too.
Lithium-ion costs have fallen 90% since 2010. Continue declining 10-15% annually. Sodium-ion from CATL and BYD offers 20-30% cost reduction for stationary applications where weight matters less.
The technology works. A homeowner can install rooftop solar with battery backup and achieve 70-90% self-sufficiency depending on climate and consumption patterns. A utility can deploy 100 MW battery systems at costs competitive with gas peakers.
Photons become electron-hole pairs. PN junctions separate charges. Electrochemical cells store energy. Power electronics manage conversions. Physics stays constant. Implementation changes.