
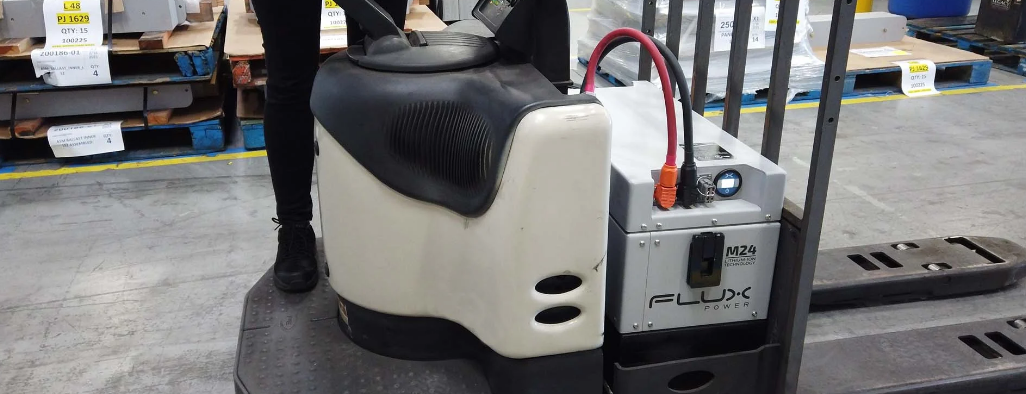
What is an AGV Battery
A forklift follows a rhythm. Run eight hours. Charge eight hours. Cool eight hours. Battery engineers have optimized for that pattern since the 1950s.
AGVs break the pattern completely.
The typical AGV in a distribution center runs 22 hours daily. Charging happens during shift changes, maybe forty minutes if operations allows it. The vehicle accelerates constantly. Stops. Starts. Navigates around obstacles. Each acceleration event pulls current. Hundreds of those events per shift.
State of charge bounces around. Never a full charge. Never a full discharge. Partial cycles all day long.
A research group affiliated with Fraunhofer IML published data in 2019 showing that AGV duty cycles create three times more mechanical stress on electrode structures compared to the same energy throughput in forklift service. The numbers varied depending on facility type, but the ratio held across different battery chemistries.
Deep-cycle lead-acid batteries rated for 1,500 cycles in forklift service? Dead in 300 cycles under AGV operation. Sometimes less. The constant partial cycling attacks degradation mechanisms that full charge-discharge cycles would leave alone.
Chemistry: The Only Decision That Matters
Everything else follows from chemistry selection. Thermal management design. Charging infrastructure. Maintenance burden. Replacement schedule. Total cost.
Pick wrong and spend the next five years fixing the mistake.
Lead-Acid Is Dead
Lead-acid dominated for decades because nothing else existed. That ended around 2012 when lithium-ion pricing dropped enough to make economic sense.
Anyone specifying lead-acid for a new high-utilization AGV installation today is either broke or bad at math. Possibly both.
The technical problems are severe. Energy density falls between 30 and 50 Wh/kg depending on construction. A battery providing adequate runtime weighs three to four times what a lithium pack would weigh. That weight comes directly out of payload capacity.
An AGV rated for 1,000 kg payload with lithium batteries may handle only 700 kg with lead-acid. Thirty percent less productive capacity from the same vehicle. Fleet managers who understand unit economics find that unacceptable.
Then there's the Peukert effect. Lead-acid capacity ratings assume you discharge slowly over twenty hours. AGVs discharge fast, 2C, 3C, sometimes 4C during acceleration. Under those conditions, a battery rated 100 Ah delivers 60 to 70 Ah. Lithium doesn't have that problem.
Cycle life is the killer. 300 to 500 cycles in AGV service before capacity drops below usable levels. With daily cycling, that's a year to eighteen months. Replacement costs compound: new batteries, installation labor, disposal fees, downtime.
Maintenance demands add further burden. Flooded lead-acid cells require water replenishment every 5 to 10 charge cycles. Skip the watering schedule and plate sulfation accelerates. Even sealed variants, marketed as maintenance-free, require periodic equalization charges and terminal cleaning.
The remaining case for lead-acid: extremely low utilization, severely constrained budget, planning horizon under two years. Outside that narrow window, it's an engineering mistake.
LFP: What Actually Works
Lithium iron phosphate LFP, LiFePO4, dominates AGV applications now. The characteristics align almost perfectly with what AGVs need.
The olivine cathode structure is thermally stable. Runaway onset exceeds 270°C, compared to 150°C to 200°C for nickel-based cathodes. More importantly, the structure doesn't release oxygen when it decomposes. Other lithium chemistries NCM, NCA release oxygen that feeds combustion. LFP cells can be abused badly and still won't chain-react into the kind of fires that make headlines.
Testing at Sandia National Laboratories (Lamb et al., 2015) showed LFP cells subjected to nail penetration at 100% SOC released less than 2% of the thermal energy observed in equivalent NMC cells. The safety margin changes everything about system design, simpler enclosures, lighter thermal management, lower insurance costs. Deployment becomes possible in environments where more reactive chemistries would require explosion-proof enclosures or be prohibited entirely.
Cycle life reaches 2,000 to 6,000 cycles at 80% depth of discharge. That range matters more than people realize.
Premium cells from established manufacturers, CATL, BYD, EVE Energy exceed 4,000 cycles when kept at reasonable temperatures and charge rates. The same cells at 40°C instead of 25°C might get half that. Cheap cells from manufacturers cutting corners on electrode coating uniformity or electrolyte purity fail at 1,500 regardless of conditions. Saving 15% on cell cost can cut service life in half. The economics of battery procurement punish short-term thinking.
Temperature sensitivity dominates LFP system design. Optimal range is 15°C to 35°C. Below freezing, charging becomes dangerous. Lithium ions can't intercalate fast enough and plate out as metallic lithium on the anode. The plating is irreversible and creates short circuit risks that may not show up for weeks. A competent BMS prevents charging below 0°C under any circumstances. Practical system design prevents charging below 5°C to provide safety margin.
Above 35°C, calendar aging accelerates. SEI layer growth doubles with each 10°C increase. An AGV pack running at 45°C loses capacity four times faster than one at 25°C. Thermal management investment pays for itself through battery longevity. CFOs who understand degradation kinetics approve cooling system budgets.
The flat voltage curve creates headaches for state estimation. Cell voltage changes only 0.3V between 20% and 80% SOC. Most voltage variation occurs below 20% and above 80%. Small measurement errors translate to large SOC errors. A 10mV measurement mistake in NCM might cause 2% SOC error. The same error in LFP can mean 10% or worse. Accurate SOC estimation for LFP requires sophisticated algorithms incorporating current integration, temperature compensation, and periodic recalibration. Voltage measurement alone produces unreliable results that frustrate fleet management systems trying to optimize charging schedules.
NCM: Rarely Worth the Trouble
NCM offers higher energy density, 200 to 270 Wh/kg at cell level compared to LFP's 160 to 180. Sounds attractive. Usually isn't.
The energy density advantage comes with thermal instability, shorter cycle life, and system complexity that adds cost and weight. The net benefit shrinks when you account for the heavier thermal management system NCM requires.
The layered oxide cathode structure becomes unstable at 150°C to 200°C depending on state of charge. Oxygen release sustains combustion. A single cell in thermal runaway can trigger neighbors through conducted heat, leading to pack-level failures that produce sustained fires and toxic gas emission.
Fire investigators who have examined NCM battery incidents in material handling equipment describe the results as catastrophic.
Managing that risk demands active cooling systems maintaining cell temperatures within a narrow band, redundant temperature sensors with multiple thermocouples or thermistors per cell group, sophisticated BMS algorithms that reduce power or disconnect the pack before dangerous temperatures develop, and mechanical designs providing thermal barriers and venting paths. The thermal management system on an NCM pack might weigh as much as the energy density savings are worth.
Cycle life runs 1,000 to 2,000 cycles, half what LFP achieves. Higher energy density means each cycle moves more energy through the cell. Cumulative mechanical stress from electrode expansion and contraction accumulates faster. The battery ages faster per cycle and delivers fewer total cycles. Double penalty.
The decision to specify NCM over LFP should emerge from quantitative analysis demonstrating that energy density advantage provides sufficient operational benefit to justify additional thermal management cost, shorter replacement cycle, and increased safety management burden.
The narrow case for NCM in AGV applications: severe space constraints where battery volume directly limits revenue. Semiconductor fabs sometimes fit this profile—cleanroom floor space costs $5,000 to $10,000 per square meter annually. A 20% smaller AGV footprint might justify the NCM complications. Even in semiconductor facilities, the trend is toward LFP as energy density improves.
Reliability engineers sleep better with LFP. NCM in material handling applications is an unnecessary risk that procurement teams accept when they fail to understand the operational environment.
LTO: The Specialist Answer
Lithium titanate uses Li4Ti5O12 as the anode material instead of graphite. The characteristics are so different that LTO occupies its own category. LTO does not compete directly with LFP or NCM. It solves different problems.
The LTO anode operates at 1.55V versus lithium reference potential, compared to 0.1V for graphite. Higher operating potential eliminates lithium plating entirely. The anode potential never approaches the threshold where metallic lithium deposition occurs. Charging at 10C rates and minus 40°C temperatures works fine, conditions that would destroy graphite-anode cells.
The spinel crystal structure of LTO exhibits less than 1% volume change during lithium insertion and extraction. Graphite electrodes swell by 10%. Dimensional stability means the electrode structure does not degrade from repeated cycling. SEI layer formation—the primary aging mechanism in graphite-anode cells, occurs to a much lesser degree on LTO anodes because the higher operating potential falls outside the voltage range where electrolyte reduction occurs.
Quality LTO cells from Toshiba, Altairnano, and Microvast exceed 15,000 cycles at 80% depth of discharge. Some formulations reach 25,000 cycles under controlled laboratory conditions. Field deployments by Toyota Industries Corporation in high-throughput logistics vehicles have demonstrated 18,000+ cycles with less than 20% capacity fade (Toyota Industries Technical Review, 2021). Calendar life extends proportionally—twenty years is achievable.
LTO provides 50 to 80 Wh/kg. Half the density of LFP. A third of NCM. A battery providing equivalent storage weighs twice as much and takes twice the space. For applications where space and weight are constrained, that penalty is severe.
Cell cost compounds the problem. LTO runs 2x to 3x per Wh compared to LFP due to specialized anode material and lower production volumes. A 10 kWh pack might cost $4,000 in LFP and $10,000 in LTO. The initial sticker shock kills many LTO evaluations before total cost analysis begins.
The economics only work at high utilization. Fleet data from Toyota Industries suggests AGV fleets running 20+ hours daily with multiple charge cycles per day,accumulating 1,200+ cycles annually, see LTO deliver lower total cost despite the high initial investment. The calculation pivots on avoided battery replacements.
With LFP at $200/kWh and LTO at $500/kWh for a 15 kWh pack, LTO breaks even if it avoids just one replacement cycle. Avoiding two replacements makes LTO significantly cheaper despite costing 2.5x more at purchase.
Fleet managers who evaluate batteries on purchase price alone miss the math entirely.
Opportunity charging transforms the operational model in ways that compound LTO advantages. Traditional AGV fleet management dedicates charging shifts typically overnight, when AGVs leave service for extended charging sessions. Opportunity charging instead uses brief charges during natural idle moments. Waiting for load/unload completion. Queue delays. Task transition periods. These charging windows may last only 5 to 15 minutes.
LTO chemistry enables opportunity charging through ultrafast charge acceptance. A 10C charge rate delivers 80% SOC in 6 minutes. AGVs with LTO batteries can operate continuously throughout a 24-hour period, capturing brief charging opportunities rather than requiring dedicated charging time. The fleet achieves higher asset utilization. The facility requires fewer AGVs to handle the same throughput. Battery swap infrastructure becomes unnecessary.
Hidden benefits emerge in infrastructure economics. Traditional charging approaches scale charger count with fleet size: one charger per AGV plus spares. Opportunity charging distributes lower-power charging points throughout the facility. Total installed power may be lower than the traditional approach despite supporting higher utilization. Charging infrastructure investment distributes across operational areas where AGVs naturally pause rather than concentrating in dedicated charging rooms.
Several cold storage operators in Europe have standardized on LTO for freezer AGVs specifically because of the cold charging capability.
Pack Engineering: Where Theory Meets Reality
Cell selection establishes the foundation. Everything else determines whether theoretical performance translates to actual operation.
Cell Formats
Cylindrical cells in 32650 or 32700 format dominate AGV LFP applications. The cylindrical geometry provides inherent mechanical strength from the wound structure, efficient heat rejection due to favorable surface-to-volume ratio, and manufacturing consistency that produces tight cell-to-cell variation. The gaps between cylindrical cells in a packed array create natural air channels that simplify forced-air cooling design.
The downside: packing efficiency. Circles don't tessellate. Gaps waste 30% to 35% of available volume. For applications where space constraints dominate other concerns, that inefficiency becomes problematic.
Prismatic cells offer improved volumetric efficiency through rectangular geometry that packs without gaps. The format enables simpler mechanical stack-up with cells clamped between endplates. Thermal management requires deliberate design because the large flat surfaces that provide packing efficiency also create thermal resistance challenges when heat must be extracted from cell centers.
Quality variation among prismatic cell manufacturers exceeds that of cylindrical cells. The electrode stacking or winding process for large-format prismatic cells presents more opportunities for manufacturing defects. Wrinkles. Misalignments. Contamination. Defects that would be caught in high-volume cylindrical production lines may escape detection in lower-volume prismatic production. Specifying prismatic cells demands careful supplier qualification and incoming inspection protocols. Skipping that diligence creates expensive problems.
Pouch cells achieve highest energy density through minimal packaging weight. The laminated aluminum pouch adds only grams to cell weight compared to the significant mass of cylindrical or prismatic metal cans. The advantage becomes meaningful in applications where every gram matters.
Vulnerability to mechanical damage creates challenges for AGV applications. Pouch cells require external compression to maintain electrode stack contact. They cannot tolerate point loads or sharp impacts. The thermal management interface must provide consistent pressure across the pouch surface. Swelling during cycling, an inevitable consequence of gas generation from electrolyte decomposition, must be accommodated in the mechanical design. Design complexity increases substantially.
For most AGV applications, cylindrical cells from established manufacturers make the most sense. The format provides the best combination of reliability, thermal management simplicity, supply chain availability, and cost-effectiveness. Prismatic cells suit applications with defined space constraints and engineering resources to manage additional integration complexity. Pouch cells rarely make sense for AGV applications outside specialized vehicles where energy density advantage justifies the integration burden.
Cell Matching
Manufacturing tolerances create variation, 2% to 3% in capacity, 5% to 10% in internal resistance, even within a single production lot from a quality manufacturer.
In a series string, the weakest cell determines pack capacity. That cell reaches discharge cutoff first while others retain charge. Over repeated cycles, the weak cell experiences deeper effective discharge than its neighbors. Deeper cycling accelerates its degradation and widens the capacity gap. Without intervention, a 3% initial capacity spread can grow to 15% or 20% within 500 cycles.
Weak cells become weaker. Strong cells cannot compensate. Pack capacity degrades faster than individual cells would suggest.
Premium pack builders test incoming cells individually, grading them by capacity within 1% bins and resistance within 5% bins. Only cells from the same grade populate a series string. The sorting adds cost through testing labor and yield loss when cells fall outside usable grades. The investment returns through extended pack life and higher usable capacity.
Cheap assemblers skip matching. A catastrophic mistake. The consequences show up at eighteen months when packs fail at twice the expected rate.
The quality of cell interconnections affects pack performance throughout service life. Welded connections provide lowest resistance and highest reliability, but require capital equipment and skilled operators. Bolted connections enable easier service access but may develop resistance increases over time due to contact oxidation and mechanical loosening from thermal cycling and vibration. Spring contacts and compression fittings suit applications requiring rapid battery swap but introduce contact resistance that reduces efficiency and creates potential failure points.
Thermal Architecture
Heat generation during operation follows predictable patterns. Resistive heating, current squared times resistance, dominates during high-power events.
Consider a 48V, 100 Ah LFP pack configured as 15S4P using 32650 cells. Each cell contributes 15 mΩ to series resistance when new, rising to 25 mΩ as the cell ages. Total pack resistance when new: 225 mΩ. At 100A discharge, resistive heating generates 2,250 W. During acceleration at 200A, heating reaches 9,000 W.
Nine kilowatts from a 60 kg pack.
The thermal mass absorbs that energy temporarily. Without active heat removal, temperature rises quickly. For LFP, the design target should maintain cells between 15°C and 35°C.

Forced air cooling handles moderate power applications, packs operating at continuous 1C with peaks to 2C. Air must contact cell surfaces directly. Baffles and ducting through intercell gaps matter.
Liquid cooling becomes necessary for high-power applications and NCM chemistry. Heat transfer coefficients exceed air by 10x or more. The system adds weight, cost, complexity, pumps, hoses, fittings, potential leak points.
Phase change materials buffer transient events. Paraffin absorbs heat while melting, limiting temperature spikes during high-power bursts. PCM can't handle continuous high power, once melted, no additional buffering until solidification.
Cold Environment Complications
AGVs in freezer warehouses, minus 25°C to minus 40°C, require specialized design. Standard lithium cells can't charge below freezing without damage.
The problem is lithium plating at the anode. Cold temperatures slow ion diffusion. If charge current pushes ions faster than they can intercalate, metallic lithium deposits on the surface. The plating creates short circuit risks that may cause sudden failure weeks later.
Battery systems for cold environments incorporate heaters, typically PTC ceramics drawing 50 to 200 W. The heaters must raise cell temperature before charging can begin. During freezer operation, insulation and discharge waste heat help maintain temperature.
Heating energy becomes a parasitic load. In extreme cases, over 10% of capacity per shift goes to heating rather than propulsion.
LTO offers advantages here. No lithium plating risk means charging at minus 40°C works. The energy density penalty matters less when competing chemistries require substantial heating energy anyway.
BMS: The Invisible Complexity
The battery management system transforms cells into a functional battery. Without it, lithium-ion would be unsafe and impossible to integrate with vehicle systems. The sophistication of BMS design and implementation directly affects battery life, safety, and operational reliability.
Measurement Subsystem
Accurate measurement of cell voltage, pack current, and temperature forms the foundation for all BMS functions. Measurement errors propagate through every calculation and decision the BMS makes.
Cell voltage sensing requires resolution suited to the chemistry. For LFP with its flat voltage curve, measurement uncertainty should not exceed 5 mV to achieve acceptable SOC estimation accuracy. The requirement demands precision ADCs, careful PCB layout to minimize noise pickup, and calibration procedures to correct for component tolerances.
Sensing architectures for series-connected cells must handle the challenge of measuring small voltage differences relative to a reference that rises as more cells are added in series. A 16S pack places the highest cell at 50V relative to pack negative. Measuring that cell's 3.2V with 5 mV accuracy while rejecting the 50V common mode requires careful circuit design. Most BMS implementations use isolated sensing for each cell group, with digital communication between isolated domains.
Current sensing uses either shunt resistors or Hall-effect sensors. Shunts offer excellent accuracy, 0.5% or better with temperature compensation, but introduce power loss and require topology decisions. A 1 mΩ shunt carrying 200 A dissipates 40 W and must be rated accordingly. Hall-effect sensing eliminates insertion loss but provides accuracy of only 1% to 2% and exhibits offset drift that complicates coulomb counting accuracy over time.
Temperature sensing requires coverage throughout the pack to identify hot spots and verify safe operating conditions. A minimum practical deployment uses one sensor per parallel cell group, typically every 4 to 8 cells. High-power applications and NCM chemistry warrant denser sensor placement.
State Estimation
SOC accuracy determines how effectively fleet management can schedule charging. Underestimate and usable capacity goes untapped. Overestimate and vehicles strand before reaching chargers.
Stranded vehicles disrupt operations far more than conservative dispatch decisions.
Coulomb counting, integrating current over time, provides the foundation for SOC tracking. The method is simple in concept: SOC changes in proportion to charge moved into or out of the battery. Implementation challenges arise from current sensor offset and gain errors that accumulate over time, from the need to track self-discharge during idle periods, and from the absence of an absolute reference when the vehicle has operated through multiple partial cycles without recalibration.
Open-circuit voltage measurement provides SOC information that does not suffer from cumulative drift, but requires the battery to rest at zero current until electrochemical equilibrium is established. For LFP cells, full equilibration may require 2 to 4 hours. Partial equilibration providing useful correction data may occur within 30 to 60 minutes. AGV operation rarely provides rest periods this long, limiting the practical utility of OCV measurement.
Model-based estimation, typically implemented as Extended Kalman Filter or Unscented Kalman Filter algorithms, combines coulomb counting with a dynamic model of battery behavior. The algorithm predicts what voltage should result from given SOC and current, compares to measurement, uses the error to correct the SOC estimate. The approach handles sensor noise gracefully and provides bounded estimation error as long as the battery model accurately represents actual cell behavior. The challenge for LFP cells lies in the flat voltage curve that provides minimal information content in the normal operating range.
SOH tracking follows capacity and resistance trends over service life. Capacity fade SOH compares current available capacity to rated capacity. A battery with 80 Ah available from a rated 100 Ah has 80% SOH. Power fade SOH sometimes tracked separately, reflects increased internal resistance that limits achievable current. Accurate SOH estimation enables predictive maintenance and rational replacement scheduling.
Cell Balancing
Imbalance develops inevitably. Manufacturing variation provides initial spread. Temperature differences cause cells to age differently. Self-discharge variation causes drift during storage.
Passive balancing bleeds charge from high cells through resistors, typically 50 to 200 mA. Slow. A 5% imbalance in a 100 Ah cell requires 50 hours to correct at 100 mA.
Active balancing transfers energy between cells. Balancing currents reach 1 to 5 A. Faster by 10x. Cost and complexity increase significantly.
Protection Functions
Overvoltage protection prevents charging beyond cell limits, 3.65V for LFP. Exceeding that accelerates electrolyte oxidation and swells cells.
Undervoltage protection prevents discharge below limits, 2.5V for LFP. Deep discharge causes copper dissolution from current collectors that creates shorts when copper redeposits.
Overcurrent protection limits charge and discharge to prevent thermal damage.
Short circuit protection disconnects within microseconds when current surges indicate faults.
Thermal protection prevents operation at dangerous temperatures, typically triggering current reduction at 45°C and disconnection at 55°C to 60°C.
Communication
CAN bus dominates AGV battery communication. Standard protocols including CANopen and SAE J1939 provide defined message structures. The BMS reports pack voltage, SOC, SOH, cell extremes, fault codes, and power limits. The vehicle control system uses this data for dispatching and status display.
Charging Infrastructure
Mismatched charging systems waste capital and may accelerate degradation. The charging infrastructure represents substantial investment that must be optimized alongside battery selection.
Contact Charging
Physical contacts engage when the AGV aligns with the charger. Simple. Proven. Spring-loaded contacts handle thousands of engagement cycles if properly designed.
The contact interface must handle high currents reliably. Contacts rated for 50A continuous service may see 100A or more during fast charge events. Contact materials typically use silver-plated copper for low resistance and durability. Spring mechanisms provide consistent contact force despite dimensional tolerances and wear.
Alignment requirements vary with contact design. Simple two-contact systems for lower-power applications may tolerate alignment errors of ±20 mm. High-power multi-contact systems need positioning within ±5 mm, necessitating more precise AGV positioning or mechanical guidance features in the charging station.
Contact wear occurs with each engagement cycle. Properly designed contacts using appropriate materials may survive 50,000 or more cycles with minimal maintenance. Poor designs or contamination from the operating environment cause accelerated wear and resistance increase. Maintenance protocols should include periodic contact inspection and cleaning.
Wireless Charging
Inductive transfer across an air gap through magnetic coupling. No physical contact. No wear. No contamination concerns.
Current systems operate at frequencies between 20 kHz and 150 kHz, with power levels from 3 kW to 50 kW and air gaps of 10 mm to 50 mm. Efficiency runs 85% to 92%, lower than contact charging at over 95%.
The efficiency penalty adds operating cost. For a 10 kWh charge twice daily over five years, the extra electricity cost reaches several hundred dollars. That cost must be weighed against eliminated contact maintenance and improved reliability in dirty environments. In dusty, dirty, or wet environments, wireless charging often wins the total cost calculation despite the efficiency penalty.
Wireless charging enables opportunity charging naturally. Pads embedded at queue positions, load stations, and staging areas charge vehicles during natural pauses. The accumulated charge from many brief sessions can maintain SOC without dedicated charging stops.
Electromagnetic compatibility requires attention during wireless charger deployment. High-power oscillating magnetic fields can interfere with sensitive electronics and magnetic storage media. Shielding and exclusion zones around charging pads protect vulnerable equipment.
Charging Profiles
The CC-CV profile charges at constant current until voltage limit, then constant voltage while current tapers.
Charge rate selection balances speed against battery stress. Higher current charges faster but generates more heat and creates steeper lithium concentration gradients within electrode particles. For LFP cells, 1C charging represents a reasonable compromise for daily operation. Reducing charge rate to 0.5C modestly extends cycle life but doubles charge time. Increasing to 2C reduces charge time but accelerates calendar aging unless thermal management maintains cells below 35°C throughout the charge.
The constant voltage phase completes charging by tapering current as cell voltage equilibrates. Termination typically occurs when current drops below 0.05C to 0.1C. Some protocols terminate at higher currents, accepting slightly reduced charge completeness in exchange for reduced time at high voltage where calendar aging accelerates.
Temperature-compensated charging adjusts voltage limits based on cell temperature. Equilibrium voltage varies 3 mV per degree for LFP. Charging to 3.65V at 45°C creates more stress than at 25°C. A smart charger or BMS that reduces charge voltage at elevated temperatures extends cycle life with minimal capacity impact.
Partial charging doesn't damage lithium-ion batteries. The memory effect from NiCd doesn't apply. AGVs maintaining SOC between 30% and 70% through frequent partial charges may age more slowly than those cycled between 20% and 100% because they avoid stress of extreme SOC levels.
The "must fully charge and fully discharge" advice that circulates in consumer electronics forums does not apply to modern lithium-ion batteries.
Failure Modes and Diagnostic Approaches
Understanding common failure modes enables effective preventive maintenance and rapid fault diagnosis. Battery failures rarely occur without warning. Recognizing early indicators allows intervention before operational disruption.
Capacity Fade
All lithium-ion batteries lose capacity over time through multiple mechanisms. SEI layer growth on the anode consumes cyclable lithium and increases impedance. Cathode crystal structure degradation reduces the number of sites available for lithium intercalation. Electrolyte decomposition reduces ionic conductivity.
Normal fade should retain 80% capacity after 2,000 to 3,000 cycles under good conditions. Faster fade indicates problems, chronic high-temperature operation, excessive charge rates, manufacturing defects, or cell imbalance allowing some cells to experience extreme SOC levels.
Sudden capacity drops suggest cell failures rather than normal aging. Gradual fade faster than expected suggests thermal or cycling stress problems requiring operational changes.

Tracking capacity across a fleet reveals patterns. Multiple packs from the same manufacturing lot showing accelerated fade? Suspect a cell quality issue. Packs in certain AGVs fading faster regardless of cell lot? Suspect vehicle-level thermal or operational problems.
Diagnostic approach: Compare measured capacity to predicted capacity based on accumulated cycles and operating history. Use periodic full discharge tests when operational schedules permit, or analyze capacity estimates from the BMS during normal operation.
Power Fade
Internal resistance increases throughout battery life as electrode surfaces develop resistive films, current collector contacts degrade, and electrolyte conductivity decreases. Higher resistance causes larger voltage drops during load events, reducing available power and increasing heat generation.
Resistance typically increases 50% to 100% over the life of an LFP battery. More rapid increase indicates accelerated aging from thermal stress or manufacturing defects.
Diagnostic approach: Measure DC internal resistance periodically through pulse tests or analysis of voltage response during operational load changes. Track resistance trends for individual cell groups to identify cells aging faster than the pack average. Some BMS designs calculate and log resistance estimates automatically, review those logs during routine maintenance.
Thermal Runaway Precursors
Runaway events are rarely instantaneous. The process typically begins with an internal fault, often an internal short circuit from manufacturing contamination, lithium plating damage, or mechanical damage. The short generates localized heating that gradually spreads. Cell voltage may drop subtly as the short circuit discharges the cell internally. Temperature may rise above normal operating patterns hours or days before the event reaches the point of no return.
Diagnostic approach: Monitor for cells showing voltage drift relative to their parallel neighbors, for temperatures elevated above normal patterns, and for sudden changes in self-discharge rate. Cells exhibiting these symptoms should be removed from service and quarantined pending analysis.
False positives are acceptable. A cell quarantined unnecessarily costs far less than a thermal event in an operating facility.
Connection Failures
Cell interconnections, module connections, and service connections can develop resistance increases or complete open circuits from corrosion, mechanical fatigue, or thermal cycling stress. Resistance increases may appear as unexplained voltage drops during high-current events. Open circuits cause immediate loss of function and may create arcing hazards.
Diagnostic approach: Measure connection resistance periodically using micro-ohm meters. Any connection showing resistance increase over time should be inspected and reworked. Bolted connections should be checked for proper torque. Welded connections showing resistance increase indicate joint degradation requiring replacement.
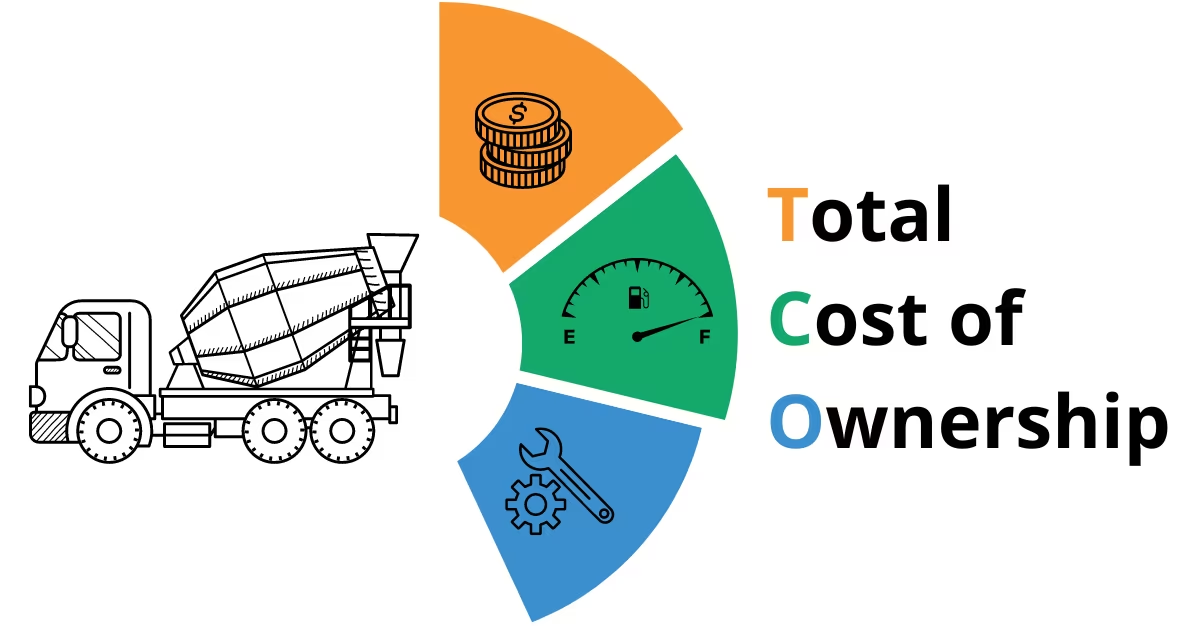
Total Cost of Ownership Analysis
Battery selection decisions must be grounded in rigorous economic analysis spanning the expected AGV deployment lifetime, typically 8 to 10 years. Purchase price represents a fraction of total battery cost. Procurement teams that optimize for purchase price destroy value.
Cost Components
Procurement includes cells, BMS, thermal management, enclosure, connectors, assembly labor. For quality LFP packs, expect $150 to $250 per kWh at the pack level. LTO runs $400 to $600 per kWh. Lead-acid costs $100 to $150 per kWh but requires frequent replacement.
Those numbers shift annually as cell costs decline and manufacturing scales. Get current quotes.
Replacement cost accumulates when batteries reach end of life before the AGV deployment ends. Lead-acid typically needs replacement every 12 to 24 months. LFP may last 5 to 8 years. LTO can last 10 to 15 years. Each replacement incurs not just battery cost but installation labor, disposal fees, and productivity loss during changeover.
Charging infrastructure includes chargers, installation, wiring, floor space allocation. Wireless systems cost 2x to 3x more than contact but may reduce operational labor and enable opportunity charging strategies that improve asset utilization.
Electricity for a 10 kWh battery charged daily at $0.12 per kWh and 92% efficiency runs $475 annually.
Maintenance covers periodic inspections, cleaning, connection tightening, troubleshooting. Lead-acid requiring watering demands more maintenance labor than sealed lithium systems.
An industry survey from MHI (Material Handling Industry, 2022) found unplanned AGV downtime averaged $15,000 per incident including production impact. A battery failure stopping a production line producing $10,000 per hour costs $40,000 for a four-hour repair.
Reliable batteries preventing such failures generate value far exceeding their premium over cheaper alternatives. Explain that to the purchasing department.
Decision Framework
For low-utilization applications operating 8 hours or less daily with limited budget and short planning horizons, lead-acid may still make sense despite its limitations.
For standard AGV applications operating 12 to 20 hours daily with normal budget parameters and planning horizons of 5 or more years, LFP provides the optimal balance of performance, reliability, and cost.
For high-intensity applications operating 20+ hours daily with frequent cycling, LTO delivers lowest total cost of ownership despite highest initial investment. The worst procurement decisions in industrial automation come from spreadsheets that ignore replacement cycles.
For applications with severe space constraints where reduced battery volume directly enables revenue generation, NCM may be justified if operational benefits exceed the additional safety management and earlier replacement costs.
An AGV battery is ultimately a component in a system designed to move materials reliably and economically. Technical specifications matter. They matter in context, operational requirements, environmental conditions, maintenance capabilities, and financial constraints. The best battery for any particular AGV application emerges from understanding requirements deeply and matching them to available technology options.