
Solar Battery Payback Period
The Sales Pitch Falls Apart Fast
Walk into any solar consultation and the battery pitch starts within ten minutes. The rep pulls out a tablet, shows a graph with a line crossing somewhere around year six, and says something like "most of our customers see full payback in five to seven years." The graph looks convincing. The math behind it is garbage.
The basic payback formula is not complicated. Take what the battery costs after incentives, divide by annual savings, get a number of years. A battery costing $10,000 after tax credits that saves $1,500 per year pays back in 6.7 years. Simple enough. The problem is that almost every input in real-world proposals gets massaged to hit a target number rather than reflect reality.
Annual savings projections assume the battery cycles perfectly every single day. They assume electricity rates only go up, never restructure in unfavorable ways. They assume the homeowner captures every available incentive, even obscure ones requiring paperwork most people never complete. They assume VPP programs pay current rates for the next fifteen years. Stack enough optimistic assumptions and any battery looks good on paper.
The commission structures driving sales behavior explain a lot. A representative selling a $15,000 battery in Florida earns the same commission whether that system achieves 5-year payback or 25-year payback.
Training programs at major installers include explicit guidance on handling payback objections by shifting conversations toward emotional benefits: energy independence, environmental responsibility, backup peace of mind. These techniques close deals. They do not represent economics with any honesty.
Proposal documents employ calculated ambiguity. Payback projections appear as ranges, allowing representatives to cite favorable ends while disclaiming unfavorable ones. Footnotes disclosing assumptions span multiple pages of fine print that nobody reads. Presentation formats emphasize monthly cash flow rather than lifetime total cost, making expensive systems appear affordable through extended loan terms that bury true costs.
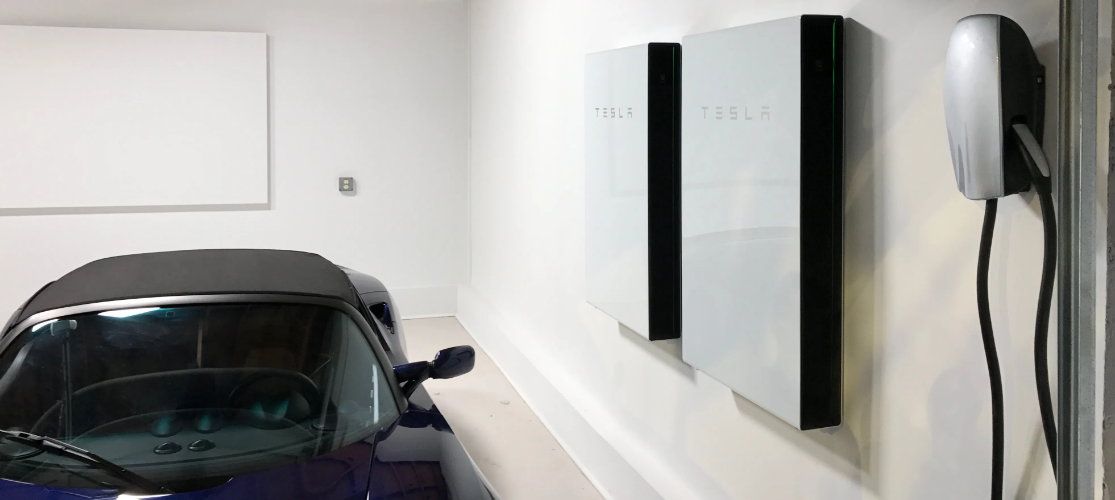
Home battery systems like the Tesla Powerwall have created a thriving secondary market
The secondary market for used batteries reflects buyer's remorse at scale. Craigslist and Facebook Marketplace in California and Arizona show steady inventory of Powerwalls and other residential batteries, often at 40-60% of original installed price, from owners who ran the numbers after installation and discovered payback timelines far exceeding what they were sold. This secondary market barely existed five years ago. Its growth tracks the gap between sales promises and delivered economics.
The information asymmetry in battery sales resembles the used car market before Carfax. Buyers lack the technical knowledge to evaluate claims. Sellers face no penalty for optimistic projections that turn out wrong. The burden of due diligence falls entirely on homeowners who have neither the time nor expertise to perform it. Industry observers have been predicting a regulatory crackdown on misleading payback claims for years. It has not materialized. State contractor licensing boards lack the technical capacity to evaluate energy storage economics. The Federal Trade Commission has shown no interest in the space. Buyers remain on their own.
California Is Where This Gets Interesting
The NEM 3.0 transition in April 2023 changed everything. Before that, California ran true net metering. Export a kilowatt-hour at noon, get credit for a kilowatt-hour you can use at night. The grid functioned like a free battery with 100% efficiency. Why buy an actual battery operating at 90% efficiency when you have a virtual one operating at 100%?
This logic kept California battery attachment rates around 10-12% for years. Batteries made sense only for backup-focused buyers willing to pay a premium for blackout protection. Economics alone could not justify storage when net metering worked so well.
Then regulators decided the free ride was over. Non-solar ratepayers had been subsidizing solar owners through net metering for years. The California Public Utilities Commission acted on long-standing utility complaints. The utilities had been arguing for over a decade that net metering shifted grid maintenance costs from solar owners to everyone else. Non-solar ratepayers, often lower-income households unable to afford solar installations, ended up subsidizing wealthier homeowners who could. The CPUC agreed. Export compensation dropped from retail rates to something closer to wholesale. Midday exports now fetch maybe five cents when retail rates exceed fifty cents during evening peaks.
The math flipped completely. Before NEM 3.0, adding a battery extended system payback by three to four years. After NEM 3.0, skipping the battery extends system payback by two to three years. Storage went from luxury to necessity overnight.
Battery attachment rates jumped from around 10% to nearly 60% within eighteen months. Solar-only installation volume cratered. SunPower filed for bankruptcy in 2024, unable to adapt a business model built on premium panels and net metering economics. The company had positioned itself as the premium choice, charging more for higher-efficiency panels that produced more power per square foot. Under net metering, that extra production had value. Under NEM 3.0, extra production just meant more low-value exports. The premium positioning became a liability. Somewhere around 17,000 jobs disappeared across the California solar industry as companies restructured or folded.
The installer scramble created quality problems. Companies desperate to sell storage hired inadequately trained crews. Electrical work quality declined. Permit violations increased. Customers reported batteries installed with incorrect wiring configurations, in locations that exceeded temperature specifications, or with software settings that failed to optimize for the new rate structures. The California Contractors State License Board saw a sharp increase in solar-related complaints in 2024 compared to previous years.
San Diego Gas and Electric territory produces the fastest paybacks in California, often under 5 years. The rate structure explains why. Summer peak rates exceed 65 cents per kilowatt-hour between 4 PM and 9 PM. Super-off-peak rates between midnight and 6 AM dip below 10 cents. That spread approaches 55 cents. A 13.5 kWh battery capturing the full spread generates over $5 in value per day during summer months. The annual arbitrage value from this single mechanism exceeds $1,500 in favorable conditions.
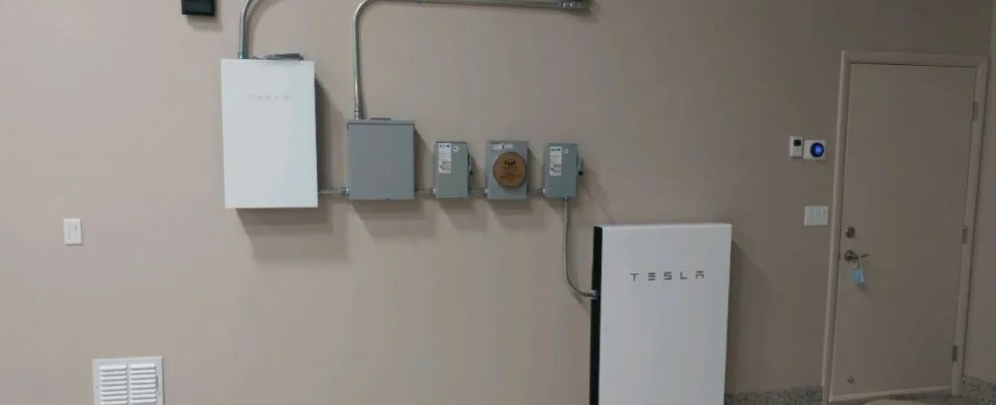
PG&E's Public Safety Power Shutoffs during fire season add backup value to battery systems
Pacific Gas and Electric territory combines high rates with frequent public safety power shutoffs during fire season, adding legitimate backup value. The PSPS events clustered in October and November create genuine blackout risk for rural and suburban customers in fire-prone areas. A Powerwall earning $1,200 annually from arbitrage and self-consumption optimization while also providing 20+ hours of backup during PSPS events represents a completely different value proposition than the same battery in a stable-grid territory.
Southern California Edison falls somewhere in between. Rate spreads run narrower than SDG&E. Grid reliability exceeds PG&E. The economics work, just not quite as well.
The California numbers work because multiple value streams stack. Arbitrage between peak and off-peak rates contributes $1,200 to $1,600 annually for a properly sized system. Self-consumption optimization under collapsed export rates adds another $600 to $900. VPP participation kicks in a few hundred more. Tesla's California VPP paid out around $10 million to Powerwall owners in 2024. Combined annual value exceeds $2,000 in favorable cases. Against net costs of $9,000 to $11,000 after federal and state incentives, the math works.
The SGIP rebate program in California adds another layer of complexity. The Self-Generation Incentive Program provides rebates for battery storage installations, with higher rebates available for low-income customers and customers in fire-prone areas. The equity budget pays $850 per kWh for qualifying customers. A 13.5 kWh Powerwall installation qualifies for over $11,000 in SGIP equity rebates if the customer meets income requirements and lives in a designated disadvantaged community. Combined with the federal tax credit, this can reduce net battery cost below $5,000. Payback periods under these conditions drop to 2-3 years.
The catch is that SGIP equity budget funds exhaust quickly. Customers must navigate a complex application process, provide income documentation, and wait for budget replenishment. The general market SGIP rebate runs much lower, around $150-250 per kWh depending on budget step. Most customers do not qualify for the equity budget. Most customers do not even know it exists.
Understanding why NEM 3.0 happened matters because every other market will follow the same path. Once distributed solar penetration hits 5-10% of generation, non-solar ratepayers and utilities push back. Export compensation declines. Self-consumption becomes the game. Batteries become mandatory equipment rather than optional upgrades. Any state approaching that penetration threshold will face similar reform pressure within a few years.
The political dynamics follow a predictable pattern. Solar industry lobbyists argue for preserving net metering. Utility lobbyists argue for reducing it. Consumer advocates split depending on whether they represent solar customers or non-solar ratepayers. The outcome depends on the specific regulatory body's composition and the balance of political forces at the moment of decision. California's CPUC proved more susceptible to utility arguments than many observers expected. Other states may go differently.
The States Where Batteries Are a Waste of Money
Florida exemplifies terrible battery economics. Electricity rates run around thirteen cents per kilowatt-hour. Full one-to-one net metering remains in effect. No mandatory time-of-use rates exist for residential customers. The state offers zero storage incentives. The federal residential tax credit expired at the end of 2025.
A battery in Florida might generate $400 in annual value from limited arbitrage on voluntary TOU plans that few people bother enrolling in. The battery costs $10,000 or more after the tax credit evaporated. Twenty-five year payback. The battery will break before it pays back.
Hurricane backup provides the only rational Florida justification, and even that argument falls apart under scrutiny. A decent portable generator runs $1,500 to $3,000 and provides similar backup capability for the two or three significant outage events per decade. The $7,000 to $8,000 price difference could fund generator fuel and maintenance for decades. The generator also works during extended outages lasting days or weeks, while a battery provides only 10-15 hours of backup before requiring solar recharge that may not be available during or immediately after a storm.
The Florida legislature has shown no interest in storage incentives. The state's investor-owned utilities have resisted net metering reform, which paradoxically keeps battery economics poor by preserving favorable solar-only economics. Florida presents a case where favorable net metering policy hurts battery adoption rather than helping it.
Texas looks similar. Fantastic solar resources meet low electricity rates and absent incentives. The state lacks mandatory time-of-use rate structures for residential customers. Most utilities offer full retail net metering. Solar makes excellent sense in Texas. Batteries do not.
The Texas grid's infamous February 2021 failure might seem like it would boost battery economics through backup value. The math does not support this. A multi-day grid collapse during freezing temperatures with minimal solar production exhausts battery capacity within hours. The backup value of residential storage during ERCOT's worst-case failure scenario approaches zero. Customers who want blackout protection during extended winter events need generators with fuel storage, not batteries.
Louisiana and most of the Deep South produce even worse numbers. Sub-ten-cent electricity rates make storage economically incoherent. A battery cannot save meaningful money when electricity costs almost nothing to begin with.
The Pacific Northwest has the same problem for different reasons. Washington and Oregon electricity rates run low because of abundant hydroelectric power. Net metering policies remain favorable. Few peak pricing programs exist because baseload supply from dams adjusts easily to match demand. The grid runs stable. Battery economics in Portland or Seattle do not work.
Massachusetts achieves viable battery economics through aggressive incentive stacking
Massachusetts achieves decent economics through aggressive incentive stacking. The SMART program adds a few cents per kilowatt-hour for solar paired with storage. ConnectedSolutions demand response pays $225 to $275 per kilowatt of summer peak capacity. Layer everything together and payback periods hit six to eight years.
The problem is that these are program-dependent economics. Program budgets have limits. Compensation rates decline as enrollment grows. SMART capacity allocations have already created waitlists in some utility territories. California economics derive from rate structures that change slowly and predictably. Massachusetts economics derive from incentive programs that could change with the next budget cycle. A homeowner betting on ten years of stable ConnectedSolutions payments is making a bet that may or may not pay off.
Hawaii stands alone with electricity prices averaging 42 cents per kilowatt-hour and genuine three to five year payback periods. Hawaii also represents less than half a percent of the US market. Building national marketing around Hawaiian economics is borderline fraudulent.
Europe
European markets operate under different conditions and comparing them directly to US markets gets misleading fast.
Germany confuses American observers. Electricity prices exceed 38 euro cents per kilowatt-hour. This should produce excellent battery economics. It does not. Feed-in tariffs still pay around 8 euro cents per kilowatt-hour for residential solar exports. This rate, about 20% of retail, weakens the self-consumption argument. German batteries rely more on arbitrage, and residential time-of-use rate adoption remains limited. Battery payback runs around nine to twelve years. The trend points toward improvement as feed-in tariffs keep declining and the grid sees more negative pricing events during sunny afternoons. German homeowners installing solar now should probably wait a couple years before adding batteries.
The Netherlands has a cleaner story. Current one-to-one net metering makes batteries pointless. Policy termination in January 2027 will make batteries necessary. Dutch homeowners should design systems with battery-ready electrical infrastructure and defer the storage purchase until the policy shift.
Spain reportedly produces the best European battery economics. Exceptional solar resources, EU Recovery Fund subsidies around 490 euros per kilowatt-hour of storage, low export rates. Payback periods reportedly match California at 5-8 years. The subsidy programs have expiration dates.
British economics depend heavily on tariff selection. The Octopus Agile tariff creates arbitrage opportunities for homeowners willing to optimize around volatile half-hourly pricing. A homeowner on a flat rate faces 12-15 year payback. The same homeowner switching to Agile achieves 7-9 years. The hardware changes not at all. Only the contracts change.
Italian battery economics have deteriorated since the Superbonus 110% program ended. That market is in transition and hard to call right now.
The European picture is fuzzier than the American one. Different countries have different feed-in tariff structures, different VAT treatments, different grid configurations. Generalizing about European battery economics risks being wrong about most specific markets.
Where Battery Value Comes From
Battery value accrues through four mechanisms and understanding which ones matter in a given market separates realistic projections from fantasy.
Peak-to-off-peak arbitrage provides the most reliable value stream where time-of-use rates exist. Southern California Edison charges over 60 cents per kilowatt-hour during summer evening peaks and around 15 cents overnight. A battery charging at night and discharging in the evening captures that spread. This generates $1,400-1,600 per year in California. The number drops below $400 in states without aggressive time-of-use structures. Utilities in flat-rate territories offer zero spread and therefore zero arbitrage value.
The mechanics of arbitrage optimization matter because most battery owners do not understand them. A properly configured battery charges during the cheapest hours and discharges during the most expensive hours.
This sounds simple. In practice, rate structures shift seasonally. Weekend rates differ from weekday rates. Holiday schedules apply. Software must predict next-day consumption patterns to reserve adequate capacity for evening peaks while still capturing overnight charging windows. Default software settings often fail to optimize for these complexities. Manual override capability exists on most systems but requires technical knowledge most homeowners lack.
Battery efficiency losses compound over time, often overlooked in sales presentations
The efficiency loss rarely gets mentioned in sales presentations. A 90% round-trip efficiency means 10% of all energy passing through the battery converts to waste heat. Over a decade of daily cycling, a 13.5 kWh battery loses approximately 4,900 kWh to inefficiency. At 35 cents per kWh, that represents about $1,700 in destroyed value. The efficiency figure degrades over time too. A battery achieving 90% efficiency when new may deliver only 85% by year eight as internal resistance increases.
Self-consumption optimization dominates battery economics in markets where export compensation has collapsed. Solar panels produce most power at midday when nobody is home. Without storage, this power flows to the grid at whatever rate the utility pays. A typical California system without storage achieves maybe 30% self-consumption. The other 70% exports at devastated rates. Adding a battery pushes self-consumption above 80%. The battery does not generate new value. It prevents value destruction. In markets with collapsed export rates, this generates $800-1,200 annually.
Grid services revenue represents the newest value stream. Tesla's California VPP paid out around $10 million to Powerwall owners in 2024. ConnectedSolutions in Massachusetts offers $225-275 per kilowatt of summer capacity. The problem is that VPP capacity grows faster than grid service demand. Tesla has reduced per-event compensation from roughly $2 per kWh in 2022 to $1-1.50 in 2024. These programs will not maintain current compensation levels as participation scales. Conservative modeling should assume 60% of current rates.
Backup power value defies quantification. A California homeowner experiencing Public Safety Power Shutoffs might value backup at $2,000 annually. A Florida homeowner who never loses power values backup at zero. Mixing insurance value with investment return produces dishonest payback figures. The average American home experiences 1.3 outage hours annually. The median experiences zero in most years.
Battery Chemistry
The residential market has converged on lithium iron phosphate chemistry. LFP batteries achieve somewhere around six to ten thousand full cycles before meaningful capacity degradation. NMC batteries achieve three to five thousand cycles. For daily cycling, this means decades of additional useful life for LFP.
LFP degrades more slowly during operation. LFP tolerates full depth of discharge without accelerated degradation, while NMC requires maintaining reserves. LFP costs less per kilowatt-hour.
Tesla Powerwall 3 uses LFP. BYD uses LFP. Most Chinese-manufactured systems use LFP. Enphase sticks with NMC for higher energy density. For typical residential applications, LFP wins on every dimension that affects payback.
Temperature affects battery longevity more than people realize. Degradation rates roughly double for every 10 degrees Celsius increase above 25 degrees. A battery in an air-conditioned San Diego garage degrades far slower than one in an unconditioned Phoenix garage hitting 45 degrees in summer. Installer site assessments rarely evaluate thermal conditions adequately. The ideal installation location would be climate-controlled interior space. Most installations end up in garages that swing between temperature extremes.
Warranty terms offer less protection than marketing suggests. A 10-year warranty guaranteeing 70% capacity at end of term does not prevent faster degradation. It provides recourse if degradation exceeds warranty terms. Expected degradation remains the owner's problem. The warranty covers defects and abnormal degradation. It does not cover normal degradation that happens to be faster than hoped.
The Financing Trap
Solar loan dealer fees represent an open secret in the industry. A loan advertising 2.99% APR often includes 25% or more in dealer fees rolled into the financed amount. The homeowner sees attractive monthly payments. The homeowner does not realize they are financing $18,750 to purchase a $15,000 battery.
The mechanics work like this. The lender offers the installer a below-market interest rate loan for the customer. The installer pays a "dealer fee" to the lender, typically 15-30% of the loan amount. The installer adds this fee to the system price before presenting the proposal. The customer sees a $15,000 battery with 2.99% financing. The customer does not see that the installer marked up the price from $12,000 to cover the dealer fee.
Financed amount: $18,750. Twelve years of payments at the stated 2.99% APR: roughly $21,250. Effective interest cost: $6,250 on $15,000 original principal. True APR: somewhere around 8%.
A "cheap" 2.99% loan with heavy dealer fees costs more than an "expensive" 6.99% loan without fees. Homeowners comparing monthly payments rather than total payment obligation consistently make the wrong choice. The industry structures loans to exploit this confusion.
Some lenders have started offering "no dealer fee" loan products at higher stated rates. A 6.99% loan without fees often produces lower total cost than a 2.99% loan with 25% fees. The monthly payment looks higher. The total payment over the loan term looks lower. Most customers never make this comparison because they fixate on the monthly number.
Cash purchases avoid the problem entirely. A $15,000 battery with 30% federal tax credit produces $10,500 net cost. If the battery generates $2,000 in annual value, payback hits 5.25 years. The same battery financed through a fee-loaded loan produces maybe $12,500 in total obligations. Payback extends to 6.25 years while appearing to cost only 2.99%.
Anyone financing a battery purchase needs total payment obligation documentation. Add up every dollar leaving your pocket over the loan term. Many batteries that make sense as cash purchases become poor investments when dealer fees inflate true costs.
The federal investment tax credit adds another layer. The credit is nonrefundable. It reduces tax liability to zero and cannot generate refunds beyond liability. A $15,000 battery produces $4,500 in ITC. A household owing only $2,000 in federal taxes captures only $2,000 in year one. Unused credit carries forward for up to five years, delaying the economics. Retirees on fixed incomes with minimal tax liability may never capture the full credit value.
The residential ITC expired at the end of 2025. This changes 2026 battery economics substantially, increasing net costs by 30%. Homeowners who wanted the credit needed to act before that deadline.
System Sizing
Most residential batteries are oversized relative to their economic optimum. Installers earn higher margins on larger systems. Homeowners conflate backup capacity desires with economic optimization.
The economically optimal battery size equals roughly 70-80% of average daily solar production surplus. A system producing 8,000 kWh annually with 35% self-consumption generates about 5,200 kWh of exportable surplus, roughly 14 kWh daily. Optimal battery sizing falls around 10-11 kWh.
Proper system sizing requires balancing economic optimization with backup requirements
Installing a 20 kWh battery on this system wastes capital. Insufficient daily surplus exists to fill the additional capacity. The extra storage generates zero return while increasing purchase cost.
Backup sizing often exceeds economic optimization. A household wanting 12 hours of backup for essential loads needs more capacity than economics alone would justify. That additional capacity generates value only during outages and should be evaluated as insurance rather than investment.
The difference between economic sizing and backup sizing creates a communication problem. A customer asks "what size battery do I need?" The honest answer depends on which question they mean to ask. If they mean "what size minimizes payback period?" the answer might be 10 kWh. If they mean "what size keeps my refrigerator running all night during a blackout?" the answer might be 20 kWh. Salespeople default to the larger number because it produces larger commissions.
What Happens From Here
Battery cell costs have declined roughly 90% over the past decade. This continues at perhaps 7-10% annually.
Current cell costs run around $115 per kilowatt-hour. Residential installed costs run $850-1,100 per kilowatt-hour. By 2028, installed costs should reach $500-700. By 2030, maybe $400-550.
A battery achieving 10-year payback at current costs achieves 6-year payback at 2028 costs and 5-year payback at 2030 costs.
Policy evolution will improve battery economics in most markets over the same period. Net metering programs face pressure as solar penetration increases. Florida will eventually modify its rules. Texas utilities will eventually implement time-of-use rates more aggressively. Ohio, Michigan, Pennsylvania will follow California's trajectory with delays.
The timing of policy changes matters more than most analyses suggest. A homeowner installing solar-only in 2025 in a state that reforms net metering in 2028 faces three years of favorable economics followed by 22 years of unfavorable economics. Designing systems for the regulatory environment that will exist during most of the system lifetime makes more sense than optimizing for current conditions.
Battery-ready system design costs relatively little. Upgrading the electrical panel, pre-running conduit, and configuring inverters for future storage addition adds $500-1,500 to solar-only installation costs.
Sodium-ion battery technology reaching commercial production could accelerate cost decline. The chemistry uses abundant sodium rather than supply-constrained lithium. CATL and BYD have announced sodium-ion products. If the technology achieves cost targets, the timeline for universal battery viability compresses.
Vehicle-to-home integration is a wildcard. Electric vehicles with bidirectional charging provide storage at zero incremental cost for households already purchasing EVs. Ford F-150 Lightning supports this. Most manufacturers have announced bidirectional capability in upcoming models. A household with a bidirectional EV parked at home during peak hours may not need a dedicated battery.
The Honest Assessment
Batteries make strong economic sense in California, Hawaii, and Spain. Massachusetts gets there through incentive stacking. Payback periods of 5-8 years justify investment.
Batteries make marginal sense in Germany, the UK, and parts of the Northeast. Payback periods of 9-12 years may or may not justify investment depending on circumstances.
Batteries make poor sense in Florida, Texas, Louisiana, and much of the Midwest and South. Payback periods exceeding 15 years cannot be justified on economics. Backup concerns might justify the purchase as insurance, and a generator often makes more sense for that.
The trajectory favors batteries everywhere. Costs will decline. Export compensation will decline. Time-differentiated pricing will expand. A market producing 15-year payback today will produce 8-year payback within 5 years.
The question is whether current conditions justify buying now versus waiting. California conditions justify buying now. Florida conditions justify waiting. Most markets fall somewhere between, requiring analysis of specific local conditions rather than reliance on national averages that mean nothing for individual decisions.
The variation between a 4-year payback in San Diego and a 22-year payback in New Orleans makes any national average useless. Homeowners must analyze their specific utility territory, rate structure, and available incentives.
Solar panels made economic sense nearly everywhere before battery storage did. This remains true in most markets. Homeowners in unfavorable battery territories should maximize solar capacity first, design systems with battery-ready infrastructure, and add storage when local economics improve. The panels generate value now. The battery can wait.