
None of these specifications tell you whether a particular system will work for your situation. Capacity and price per kWh, the numbers that dominate comparison charts, explain maybe 30% of what determines whether an installation succeeds or fails over fifteen years. The other 70% involves factors that rarely appear in comparison shopping: cell sourcing, BMS implementation, thermal management design, inverter power rating versus capacity ratio, and installation quality.
This isn't a comprehensive guide covering every consideration. Instead it focuses heavily on the factors that actually determine long-term outcomes based on field data, research publications, and documented failure modes. Some topics that fill pages in other guides, like monitoring apps and smart home integration, get minimal attention here because they contribute minimally to system success or failure over a fifteen-year operational lifetime.
LFP Chemistry
That 2019 Arizona garage fire that destroyed a home and injured several firefighters? NMC batteries. The subsequent recalls affecting LG Chem RESU units traced to manufacturing defects that created thermal runaway risks in NMC cells. These incidents effectively ended the chemistry debate for residential storage. LFP won.
Not because LFP is perfect. This chemistry gives up about 30% energy density compared to NMC, which is why Tesla still uses NMC in vehicles where range depends on minimizing battery weight. But stationary storage in a garage or utility room has no weight constraint. Nobody cares if a home battery weighs 100 kg or 150 kg. So the density disadvantage disappears entirely.
What remains is a safety margin that matters for equipment installed in attached garages where families sleep. LFP thermal runaway onset sits around 270°C. NMC starts the same cascade somewhere between 150 and 200°C depending on state of charge. CATL published thermal abuse testing data in 2021 showing their LFP cells surviving nail penetration tests that caused immediate thermal runaway in comparable NMC cells. Nail penetration is an extreme test, but over fifteen years of operation a battery may encounter manufacturing defects, installation errors, rodent damage, moisture intrusion, or software failures. Having seventy-plus degrees of extra thermal margin against all those potential problems is worth something.
Cycle life gaps are even more decisive than safety margins for the economics. Contemporary LFP from tier-one manufacturers delivers north of 6,000 cycles to 80% capacity retention. Some cells, notably BYD's Blade battery architecture, have demonstrated over 8,000 cycles in accelerated testing. Tesla's 4680 cells use NMC chemistry for vehicles but the company switched to LFP for Powerwall precisely because of the cycle life advantage. NMC chemistry tops out around 2,000 to 3,000 cycles to equivalent retention regardless of manufacturer.
Daily cycling applications reveal the math clearly. A $12,000 system lasting 8,000 cycles costs $1.50 per cycle. A $10,000 system lasting 2,500 cycles costs $4.00 per cycle. That apparently cheaper option is actually 2.7x more expensive per unit of useful service delivered.
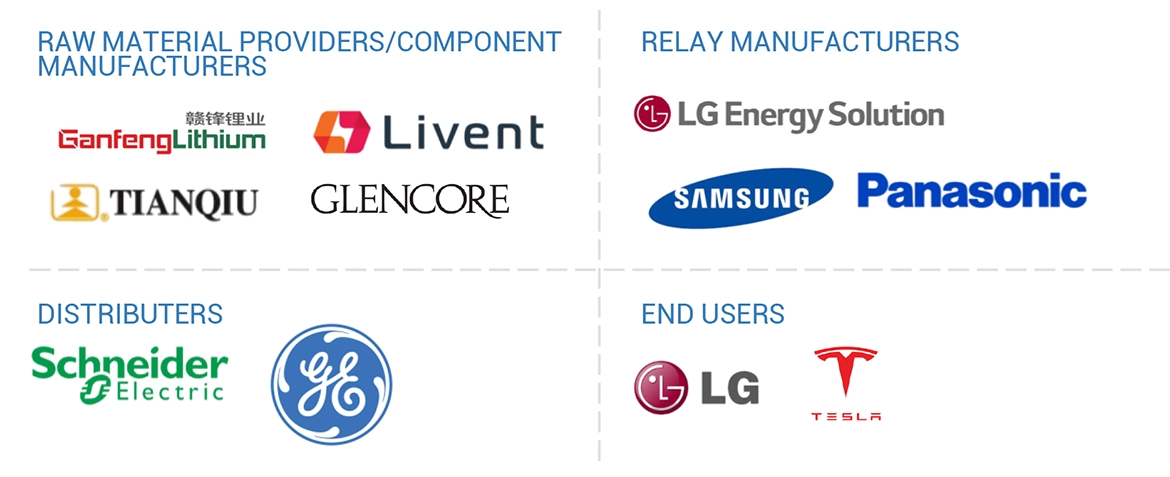
CATL, BYD, EVE Energy, Gotion High-Tech. These four supply most of the cells going into residential storage products regardless of what brand name appears on the enclosure. Tesla sources from CATL and BYD depending on product line and production timing. Enphase uses cells from multiple suppliers. Generac's PWRcell uses CATL cells. Knowing which cells are inside matters more than knowing which logo is on the outside because the logo represents marketing and distribution while the cells represent electrochemistry and manufacturing quality.
That 2022 DOE report on residential storage deployment found systems using tier-one LFP cells showed warranty claim rates under 2% through five years of operation. Systems using cells from smaller manufacturers showed claim rates above 8%. Same chemistry, same nominal specifications, very different outcomes in the field.
Pack design explains much of that gap. Dr. Gregory Offer's research group at Imperial College London published extensively on how cell arrangement, thermal management, and BMS algorithms affect realized cycle life. Two packs using identical cells can diverge 40% in longevity based purely on engineering decisions made at the pack level. Cell selection gets you to the starting line. Pack engineering determines how much of that potential gets realized versus wasted.
This makes buying decisions harder than comparing spec sheets suggests. A company like Sonnen, using LFP cells in a well-designed pack with sophisticated BMS, delivers different real-world performance than a generic import using the same cell chemistry but cutting corners on thermal management. Both claim similar specifications. Both use LFP. Only one actually delivers the promised performance over a decade of operation.
Warranty terms offer some signal through the noise. Manufacturers confident in their pack design offer cycle count guarantees that put real money behind their claims. SimpliPhi (now Briggs & Stratton Energy Storage) was among the first to offer 10,000 cycle warranties on their LFP products back when that seemed aggressive. Tesla's current Powerwall warranty covers 70% capacity retention at 10 years with unlimited cycles, which is a bet that their cells and pack design will hold up to whatever usage pattern customers throw at it. Franklin Home Power warrants 70% at 12 years or 6,000 cycles, whichever arrives first.
Pay attention to the warranty that specifies only years without mentioning cycles. Someone is hiding something.
Sizing
BloombergNEF's 2023 residential storage survey found the median US installation at 12.4 kWh, up from 9.8 kWh in 2020. Bigger systems are trending partly because battery costs dropped faster than installation costs, making incremental capacity relatively cheaper. Also partly because Tesla's Powerwall comes in one size (13.5 kWh) and dominates market share, pulling the median toward its specifications regardless of whether that capacity matches actual needs.
Bigger is not automatically better though.
A household consuming 25 kWh daily has different requirements than one consuming 40 kWh. Summer consumption doubling winter consumption is normal in air-conditioned climates. One family's 25 kWh average might break down to 35 kWh daily in July and 15 kWh in March. Sizing for the average gets you a system that's undersized in summer when you need capacity most and oversized in winter when you need it least.
Peak shaving applications really only care about high-rate hours, nothing else. PG&E's E-TOU-C rate in California charges $0.52/kWh during 4-9 PM peak versus $0.36/kWh off-peak, a spread of $0.16/kWh. If consumption during those five peak hours averages 6 kWh daily, the storage target is 6-8 kWh usable capacity. Buying 15 kWh for that application means half the capacity sits at partial depth of discharge most days, generating no additional savings while requiring thousands of additional investment dollars.
Hawaiian Electric's rate spread exceeds $0.35/kWh in some rate schedules, the highest in the country and the reason Hawaii leads the nation in residential storage adoption per capita. Conversely, most utilities in the Southeast have spreads under $0.10/kWh, making arbitrage economics marginal or negative after accounting for round-trip efficiency losses.
Backup sizing follows completely different logic because backup isn't about daily economics but about surviving specific outage scenarios. load analysis data showing typical critical loads, the combination of refrigerator plus some lighting plus router and communication equipment, totaling 200-400 watts continuous depending on refrigerator efficiency and lighting usage. Supporting that baseline for 24 hours needs maybe 6-8 kWh after accounting for inverter efficiency losses. So a single Tesla Powerwall or Enphase IQ 10 handles basic backup comfortably.
Then someone tries to run air conditioning during a summer outage and discovers the system doesn't work.
A 1.5 ton mini-split draws around 1,200 watts average while running on a hot day. Eight hours of cooling during a summer outage demands another 10 kWh on top of baseline loads, more than doubling the required capacity. Whole-home backup with climate control through a multi-day outage pushes into 20-30 kWh territory before accounting for any other loads. At that point, two Powerwalls (27 kWh combined) or multiple Enphase modules become necessary.
Here's where the power versus energy distinction causes more failed backup events than any other sizing issue. Schneider Electric published a technical bulletin in 2022 documenting that roughly 15% of residential backup installations fail their first real outage test due to undersized inverter power ratings relative to motor startup loads. The battery had plenty of capacity. The inverter couldn't deliver it fast enough when the compressor kicked on.
A refrigerator draws 150 watts running but 800-1200 watts for the half-second when the compressor kicks on, a 6x startup surge. A central air conditioner rated at 3,000 watts continuous might demand 12,000 watts during the first few seconds of compressor startup, a 4x surge. An inverter rated for 5 kW continuous cannot start that air conditioner regardless of how much battery capacity sits behind it, no matter how many kWh are available.
Generac's PWRcell inverter handles 9 kW continuous with 11 kW peak, adequate for most air conditioning startup scenarios. Tesla's Powerwall 3 delivers 11.5 kW continuous, which is why Tesla specifically markets it for whole-home backup. Enphase's IQ system tops out at 3.84 kW per battery unit, requiring multiple units paralleled for whole-home backup with significant motor loads. SolarEdge's Home Battery provides only 5 kW continuous power despite 10 kWh capacity, a common mismatch that limits backup functionality.
These power rating differences matter more than they appear in comparison charts because capacity is easy to compare but power adequacy depends on specific loads in specific homes.
Inverters
High-frequency versus low-frequency topology was a real debate five years ago. Contemporary high-frequency designs from SMA, Fronius, and SolarEdge have closed the overload tolerance gap that used to favor low-frequency transformers with their massive iron cores. Remaining advantages of low-frequency, the ability to handle extreme surge loads from large motors and well pumps, apply mainly to installations with workshop equipment or agricultural loads that most suburban homes don't have.
Transfer time is the specification that actually affects user experience during outages.
Powerwall 3 switches in under 20 milliseconds, fast enough that even momentary interruption-sensitive equipment like computer UPS units cannot detect the transition. From the perspective of every device in the house, power never went out. Some budget hybrid inverters, particularly older models from Chinese manufacturers entering the US market, require 200-500 milliseconds for transfer. That's long enough to cause computer reboots, reset digital clocks throughout the house, and potentially corrupt files if a write operation was in progress. The money saved on the inverter gets spent on aggravation.
MPPT efficiency for solar integration sounds like a minor specification difference but compounds over years of operation. Gap between 99% and 95% tracking efficiency seems trivial in isolation. On a 6 kW array over 20 years, that 4% gap costs several thousand dollars in unrealized generation because the inverter failed to extract maximum power from the panels hour after hour, day after day, year after year.
SolarEdge's HD-Wave inverters achieve 99.2% weighted efficiency, among the best available. Fronius and SMA achieve similar numbers in their premium products. Some generic inverters claiming 98% peak efficiency may deliver only 94% weighted efficiency under real-world partial-load conditions because peak efficiency occurs only at optimal operating points that real systems rarely maintain. Weighted efficiency, calculated across the actual operating range, is the number that matters for production estimates.
BMS
Dr. Xiangming He's group at Tsinghua University has published more on BMS impact than probably any other research group worldwide. Their 2021 paper in Journal of Power Sources documented that BMS algorithm sophistication alone accounts for 15-25% variation in achieved cycle life from identical cells. Same cells, same usage patterns, different BMS software, wildly different outcomes.
Cell-level monitoring versus string-level monitoring represents the most significant BMS design choice for longevity. Pack architectures that monitor voltage only at the string or module level rather than individual cells miss early indicators of cell degradation entirely. By the time a problem shows up at string level, multiple cells may have degraded or one cell may have failed significantly. At that point intervention options narrow to expensive replacement rather than simple rebalancing.
Victron's Lynx Smart BMS documents monitoring of individual cells. Tesla's Powerwall BMS monitors at cell level according to teardown analyses published by Munro & Associates. Many residential products simply don't disclose monitoring architecture at all, which is not encouraging.
Balancing current specification rarely appears in consumer documentation but significantly affects long-term capacity retention.
Balancing currents under 100 mA allowed cell-to-cell capacity divergence of 8-12% over 3,000 cycles, meaning the pack effectively lost 8-12% of usable capacity as cells drifted apart. Meanwhile 1A+ active balancing limited divergence to under 3%, preserving nearly all the original capacity for use. Triple the balancing current, preserve 5-10% more capacity over the pack lifetime.
Some products disclose these specifications if you dig. Victron's documentation specifies 1A active balancing current. Pylontech's US2000 series uses 0.5A. Most consumer-oriented products simply claim "advanced BMS" without further detail, which tells you nothing about actual implementation.
Temperature sensor distribution affects whether the BMS can catch thermal anomalies before they propagate into real problems. EV industry standard calls for 4-6 sensors per module, providing thermal visibility throughout the pack interior. This standard has not consistently transferred to residential storage products. Some residential packs economize with 1-2 external sensors, creating thermal blind spots where cell degradation or thermal events can develop undetected until they become serious.
Installation
That 2023 IBEW study on residential solar and storage installation defects found loose DC connections in 23% of inspected installations. Undersized conductors in 11%. Improper grounding in 18%. These are not exotic failure modes requiring specialized expertise to prevent. They represent basic electrical installation quality that varies dramatically across contractors.
Installer selection probably matters as much as product selection for long-term outcomes.
DC systems sustain arcs longer than AC systems because current never crosses zero to help extinguish the arc naturally. NEC 2020 code cycle added requirements for DC arc-fault detection in PV systems precisely because DC connection failures had caused documented fires. Battery installations face identical risks at higher currents.
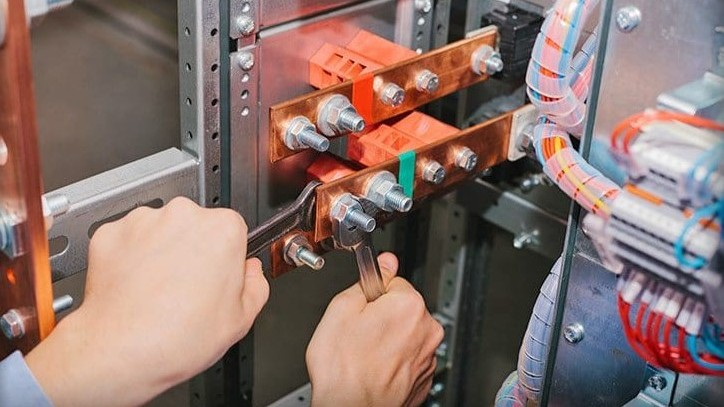
Torque specification for a typical battery terminal connection runs 8-12 Nm depending on terminal design. Achieving that torque reliably requires a calibrated torque wrench, not the "feels tight enough" approach that the IBEW study documented at roughly half of inspected installations. A connection torqued to 6 Nm when it should be at 10 Nm may function fine initially. Over thousands of thermal cycles as the battery heats during charging and cools overnight, that connection loosens further. Eventually it develops resistance. Resistance generates heat. Heat accelerates oxidation. And one day, years after installation, something fails.
Conductor sizing affects system efficiency for the entire operational lifetime. Undersized cables create voltage drop under load, wasting power as heat with every charge and discharge cycle for fifteen years. On a daily-cycling system, that accumulated waste translates to hundreds of dollars over the system lifetime. It also accelerates conductor aging from thermal stress.
NREL's fielded system study found accelerated degradation correlating strongly with average operating temperature. Systems in unconditioned spaces in hot climates showed 30-50% faster capacity decline than systems in conditioned spaces in temperate climates. That garage wall on the south side of a house in Phoenix can exceed 60°C on summer afternoons during peak cooling season. Installing a battery on that wall, even an LFP battery with good thermal tolerance, is asking for faster-than-expected aging.
LFP cells handle heat better than NMC but still show measurable degradation effects above 35°C sustained operation. Charging at temperatures below 0°C causes lithium plating regardless of chemistry, permanently damaging the anode structure. Better BMS implementations block low-temperature charging entirely or activate battery heating systems first. Budget implementations may allow damaging charge events to occur.
Economics
Lawrence Berkeley National Laboratory's annual Tracking the Sun report provides the most comprehensive publicly available data on installed costs for residential solar and storage systems in the US. Their 2023 data showed median residential storage costs at $1,050/kWh for the battery equipment alone, $1,400/kWh fully installed including labor, permitting, and electrical work. Total system costs for typical 10-15 kWh installations ranged from $12,000 to $22,000 depending on installation complexity, regional labor rates, and whether the storage was added to an existing solar system or installed with new solar.
Federal Investment Tax Credit currently covers 30% of installed cost including both equipment and labor, reducing effective cost substantially for taxpayers with sufficient liability to utilize the credit. Several states add additional incentives on top. California's SGIP program provided rebates up to $200/kWh in equity-qualifying areas as of early 2024, though program funding has been intermittent.
Payback depends almost entirely on local rate structures, which vary enormously across the country.
Rocky Mountain Institute's 2022 analysis found payback periods ranging from 5 years in Hawaii and parts of California to 15+ years in states with flat rate structures and low net metering compensation. That's a 3x variation in payback timeline based purely on geography and utility service territory.
Time-of-use differentials drive arbitrage economics completely. PG&E's peak-to-off-peak spread exceeds $0.25/kWh in most residential rate schedules. Hawaiian Electric's spread exceeds $0.35/kWh in some rate schedules, the highest in the country. Most utilities in the Southeast and parts of the Midwest have spreads under $0.10/kWh, which after accounting for round-trip efficiency losses of 10-15%, leaves almost nothing for arbitrage value.
Backup value calculation is harder to quantify but represents real economic value for some households. Insurance actuaries at Swiss Re estimated residential outage costs at $2-5 per kWh of unserved load depending on duration and circumstances like food spoilage, temporary housing needs, or lost work productivity. A household dependent on medical equipment faces implicit outage costs much higher than that average. A household running a home business that bills hourly may lose hundreds of dollars during a workday outage. For those use cases, backup value alone can justify storage investment even when arbitrage economics don't pencil.
2023 data showed residential behind-the-meter storage at $0.35-0.56 per kWh-cycle on a levelized basis, compared to utility-scale storage at $0.12-0.18 per kWh-cycle. That residential premium reflects higher per-kWh installation costs and less optimized cycling patterns compared to utility-scale facilities with full-time operations staff.
Product Landscape
Tesla dominates market share in the US, with Powerwall installations exceeding all competitors combined according to Wood Mackenzie's quarterly tracking data. This dominance reflects Tesla's brand recognition, direct-to-consumer sales model, and integration with Tesla solar installations as much as product superiority. Powerwall 3, released in 2024, integrated the solar inverter directly into the battery unit, simplifying installation but creating vendor lock-in for solar integration since third-party inverters won't work with it.
Enphase has built share rapidly through its modular architecture and strong installer relationships. Ability to start with one 5 kWh battery unit and expand later appeals to customers uncertain about their long-term needs or working with limited initial budgets. Tradeoff is lower power rating per unit (3.84 kW each) compared to integrated systems, requiring multiple units paralleled for whole-home backup applications.
Franklin Whole Home has carved out a niche specifically in backup-focused applications. Their 13.6 kWh battery with integrated inverter was designed from scratch for whole-home backup scenarios, with a 10 kW continuous power rating that handles motor loads better than many competitors. Less household name recognition than Tesla or Enphase but solid engineering.
Generac leveraged its existing generator dealer network to build distribution for PWRcell battery storage, giving the product broader geographic availability than solar-specialist brands in areas underserved by dedicated solar installers. The company understands backup power from decades in the generator business, which shows in product design priorities.
Sonnen represents the premium end of the residential market, with German engineering heritage and price points to match. Their ecoLinx product line targets high-end homes with sophisticated load management features and premium fit-and-finish. Whether the premium justifies the cost depends on how much the buyer values aesthetics and home automation integration versus raw performance per dollar.
Chinese manufacturers including Pylontech, Huawei, and GoodWe offer lower price points but variable distribution and support availability in the US market. Cost-sensitive buyers may find good value; buyers prioritizing long-term support availability and warranty service may prefer established Western brands with deeper US infrastructure. Huawei specifically faces uncertain regulatory status due to telecom equipment restrictions, which may affect future service and support.
Warranty and Service Reality
Warranty documents require careful reading beyond the headline numbers.
Tesla's Powerwall warranty covers 70% capacity retention at 10 years with unlimited cycles, which sounds generous until you realize 70% retention may arrive well before 10 years if the system cycles aggressively. The warranty promises you won't fall below that floor by year 10, not that you'll stay near 100% until then.
Franklin's 12-year warranty comes with a 6,000 cycle limit. At one cycle per day, that's roughly 16 years of cycles, so the 12-year calendar limit triggers first for most users. At 1.5 cycles daily, common in high TOU differential areas, the 6,000 cycle limit arrives at year 11. Either way, reasonable terms.
Enphase warrants their IQ batteries for 10 years or 4,000 cycles, whichever arrives first. Daily cycling would exhaust the cycle limit in about 11 years, so the 10-year calendar limit triggers first for typical use.
The important question is what happens when warranty service is actually needed. Tesla handles warranty service through their own service network, which works well in metro areas but can mean long wait times in rural areas. Enphase relies on certified installers for warranty service, which works if your original installer is still in business and still certified. Generac leverages its generator dealer network for service, providing broader geographic coverage than solar-specialist brands.
Sonnen and other premium European brands may require shipping equipment to regional service centers, adding delay and complexity to warranty claims compared to brands with local service infrastructure.
Chinese manufacturers selling through distributors present the most variable warranty experience. Pylontech and Huawei have established US service operations, though coverage depth varies by region. Smaller brands may require shipping to West Coast warehouses for warranty service, with return timelines measured in weeks rather than days.
Asking your potential installer about warranty service logistics before purchasing reveals whether they have actually navigated warranty claims with their proposed product or are just reading from a spec sheet.
Making the Decision
What actually matters for long-term outcomes, based on field data and research rather than marketing:
LFP chemistry from a tier-one cell manufacturer (CATL, BYD, EVE, Gotion) eliminates most failure modes related to battery degradation and thermal events. This is the non-negotiable foundation. Don't compromise on chemistry to save money.
Inverter power rating adequate for expected loads including motor startups determines whether backup actually works when needed. A system that cannot start the air conditioner during a summer outage has failed its primary backup function regardless of how much capacity it has. Check the surge rating specifically, not just continuous.
Installation by a qualified contractor who documents their work addresses the 20%+ defect rate that the IBEW study documented. Ask for torque verification records. Ask for as-built documentation. If the installer can't provide those, find a different installer.
Capacity matched to actual consumption patterns rather than installer recommendations prevents both undersizing that limits functionality and oversizing that wastes capital. This requires pulling consumption data and doing the math rather than accepting a standard package.
Brand and feature considerations come after these fundamentals. A well-designed system with basic monitoring from an established manufacturer will outperform a poorly designed system with sophisticated dashboards from a startup that may not exist in five years.
Products available today work. LFP technology is mature. Inverter technology is mature. The failure mode that actually matters is getting the combination of product selection and installation quality wrong. Getting both right yields a system that operates effectively into the 2040s. Getting either wrong yields problems that emerge gradually over years until expensive remediation becomes necessary.