The best temperature is 15°C, give or take a few degrees depending on who manufactured your cells and what electrolyte they used. But the short answer is also somewhat useless without understanding why, and more importantly, understanding when the "optimal" number stops mattering and other factors take over.
Most of what gets published online about battery storage temperature is either too conservative (manufacturers covering liability) or too simplified (content mills recycling each other). The actual electrochemistry is more interesting and more unforgiving than either camp suggests.

A disassembled 18650 lithium-ion cell revealing the cylindrical electrode assembly
Where 15°C Comes From
Battery aging at different temperatures follows Arrhenius kinetics. Plot ln(aging rate) against 1/T and you get a V-shaped curve, not a straight line. The V-shape matters because it reveals two different degradation mechanisms fighting for dominance.
Above roughly 25°C, SEI layer growth wins. The solid-electrolyte interphase keeps thickening as solvent molecules diffuse through it and react at the electrode surface. Warmer temperatures mean faster diffusion, faster reaction, faster capacity loss. The relationship is exponential. Schmalstieg's 2014 work on NMC cells measured activation energies around 24-30 kJ/mol for calendar aging, which translates to roughly doubling the aging rate for every 10°C increase. Ecker's group at RWTH Aachen found similar values, 22-28 kJ/mol, when they tested commercial 18650 cells across temperature ranges from 25°C to 50°C over 18 months.
Below roughly 20°C, lithium plating becomes the concern. Not during storage itself, but during the next charge cycle. Cold graphite has sluggish lithium diffusion kinetics. Charge a cold battery and lithium ions pile up on the surface instead of intercalating properly. Waldmann's group at ZSW has published extensively on this, showing the V-shape minimum shifting depending on C-rate and electrode design. Their 2014 post-mortem study found that cells cycled at 0°C showed lithium plating even at C/2 rates, while cells at 25°C showed none until C-rates exceeded 1C.
The minimum of the V falls somewhere between 15°C and 25°C for most commercial cells. 15°C sits comfortably on the low-temperature side of that minimum while staying far enough from plating territory.
At 15°C, SEI growth runs at about half the rate it does at 25°C, and since you are not charging during storage, the plating risk is zero.
Some will argue for 10°C or even 5°C. In theory, lower is better for SEI suppression. In practice, the gains become marginal while the risks multiply. Warehouse climate control at 10°C costs significantly more than at 15°C. Temperature cycling around condensation points introduces moisture problems. And whoever takes that battery out of cold storage will almost certainly try to charge it before it warms up properly. The NREL study from 2015 on grid storage applications found that the operational cost of maintaining 10°C storage exceeded the value of the extended battery life for most use cases. The crossover point where aggressive cooling pays for itself depends heavily on local electricity costs and the replacement cost of the batteries being stored.
Standard carbonate-based electrolytes become noticeably more viscous below 10°C, which affects ionic conductivity and can cause problems during the first few charge-discharge cycles after removal from storage. Cells that have been cold-soaked for months may show temporarily elevated impedance until the electrolyte redistributes and the temperature equilibrates. This is not permanent damage, but it can cause BMS faults or reduced power capability if the battery goes directly into service without a warmup period.
Schematic representation of lithium-ion cell operation
SEI
SEI gets discussed so often in battery literature that it has become almost meaningless jargon. Everyone knows it matters. Few people understand exactly how.
Aurbach's work from the late 1990s first characterized the dual-layer structure using XPS and FTIR spectroscopy. The inner portion, adjacent to the graphite, consists mainly of inorganic compounds: lithium fluoride, lithium carbonate, lithium oxide. Dense, ionically resistive, relatively stable. The outer portion contains organic decomposition products: lithium ethylene dicarbonate and similar species. Porous, mechanically weak, constantly reorganizing.
The ratio of inorganic to organic components depends on electrolyte formulation, formation protocol, and operating history. Cells formed at higher temperatures tend to have thicker SEI with more organic content. Cells formed at lower temperatures or with certain additives have thinner, more inorganic-dominated SEI. Two cells with identical electrode chemistry can have substantially different SEI structures and substantially different aging characteristics depending on how they were manufactured.
Pinson and Bazant's 2013 model describes SEI growth as solvent-diffusion-limited. Thickness increases with the square root of time because thicker SEI means longer diffusion paths, which slows further growth. The diffusion coefficient follows Arrhenius temperature dependence, so the whole system is temperature-sensitive at every step. The model fits experimental data reasonably well for moderate temperatures and moderate states of charge.
When does it fail?
Particle cracking exposes fresh electrode surface, triggering rapid new SEI formation. Dahn's group at Dalhousie has shown that silicon-containing anodes are particularly prone to this because silicon expands by 300% during lithiation, which fractures both the active material particles and the SEI covering them. Even pure graphite anodes can crack under aggressive cycling conditions. Once cracking starts, the nice predictable square-root behavior gets replaced by a more erratic aging curve that depends on the rate of new surface exposure.
High temperatures cause organic SEI components to decompose and reorganize. Broussely's 2001 study found that cells stored above 50°C showed capacity fade curves that accelerated rather than decelerated, because the SEI was no longer providing stable passivation. Safari and Delacourt published detailed models of this in 2011, showing how parasitic reaction kinetics interact with diffusion limitations. Their work suggests that above approximately 55°C, the degradation mechanisms shift from diffusion-controlled to reaction-controlled, and the nice predictable square-root behavior disappears entirely.
A battery stored at 60°C for three months may have different failure modes than one stored at 30°C for two years, even if the total capacity loss looks similar. The high-temperature cell is more likely to have gas generation issues, electrolyte dry-out in localized regions, and compromised SEI that will behave unpredictably when the cell returns to service.
Keil's 2016 study from TU Munich added another wrinkle: the temperature sensitivity of calendar aging at 100% SOC was about 30% higher than at 50% SOC, meaning the Arrhenius slope was steeper at high charge states. 15°C at 50% SOC is considerably better than 15°C at 100% SOC, and the gap widens at higher temperatures.
One detail that often gets overlooked in storage discussions: the SEI continues to evolve even without any electrochemical cycling. Solvent molecules slowly diffuse through the existing SEI, reach the graphite surface, and react. The reaction products thicken the SEI and consume lithium from the cathode's lithium inventory. Over time, the cell loses capacity not because the electrodes have degraded but because the lithium that shuttles between them during charge and discharge has been permanently sequestered in the SEI.
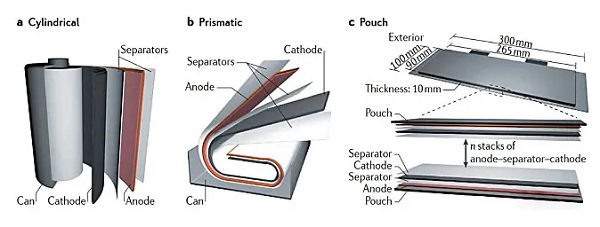
Modern lithium-ion batteries come in various form factors
LFP, NMC, and the Others
LFP has a reputation problem. The reputation is good, but the reality is more complicated.
The olivine structure is thermodynamically stable at high temperatures, with decomposition onset around 270°C versus 200-210°C for layered oxides. For safety purposes, LFP wins. The phosphate group holds onto its oxygen much more tightly than the metal oxide layers in NMC or NCA, which means LFP cells are far less likely to experience thermal runaway even under severe abuse conditions.
The flat voltage curve of LFP makes accurate SOC estimation difficult. BMS algorithms that work fine for NMC can produce 30-40% SOC errors on LFP. A battery that thinks it is at 50% SOC may be sitting at 80%, which means higher anode potential and faster SEI growth than expected. The Recurrent Auto study on Tesla LFP packs showed calendar degradation rates comparable to NCA packs despite the supposedly superior chemistry. Part of that may be the 100% charging recommendation that Tesla gives for LFP, which keeps the anode at low potential longer. Part of it may be that LFP's reputation for durability was built on cycle life data, not calendar life data, and the two do not always correlate.
Koltypin's 2007 paper identified iron dissolution as a calendar aging mechanism in LFP. Dissolved iron migrates to the anode and catalyzes electrolyte decomposition. The effect is smaller than manganese dissolution in NMC, but it exists and becomes measurable above 45°C. The iron dissolution rate follows its own Arrhenius relationship, with activation energy around 50 kJ/mol.
LFP also has a specific vulnerability to moisture. The olivine structure can undergo surface hydrolysis in humid conditions, forming iron phosphate hydroxides that increase impedance and reduce capacity. LFP pouch cells in humid climates can show accelerated aging if packaging integrity is compromised.
High-nickel NMC tells a different story entirely.
Jung's 2017 work showed that NMC811 cathodes stored at 60°C for just two weeks showed measurable rock-salt formation at the particle surfaces, while NMC532 cathodes under the same conditions showed none. The rock-salt phase is electrochemically inert, so surface reconstruction is equivalent to active material loss. More importantly, the rock-salt layer impedes lithium ion transport, which increases impedance and reduces rate capability.
When nickel is oxidized to the 4+ state (which happens above about 80% SOC), the Ni-O bond weakens and oxygen can escape from the crystal structure. The released oxygen does not usually leave the cell as gas; instead, it reacts with the electrolyte, generating heat and decomposition products. NMC811 cells need tighter SOC limits during storage than NMC532 cells did.
LCO remains common in consumer electronics despite being probably the worst mainstream chemistry for storage. The layered structure is unstable at high delithiation, cobalt dissolves readily into the electrolyte. Amatucci's 1996 work first characterized the structural instability of highly delithiated LCO, and nothing about the fundamental chemistry has changed since then. Apple's battery health feature exists partly because of how badly LCO handles abuse.
LTO is the outlier. The lithium titanate anode operates at 1.55V versus lithium, well above the potential where SEI forms. The standard electrolyte reduction reactions that create SEI on graphite simply do not happen on LTO because the thermodynamic driving force is absent. No SEI formation means no SEI growth. Calendar aging drops by an order of magnitude. LTO cells can sit for years in conditions that would destroy graphite-anode equivalents. Altairnano's early LTO cells from the late 2000s are still showing minimal degradation after 15+ years of testing. The tradeoff is lower energy density and higher cost, which limits LTO to niche applications where long shelf life justifies the premium.
Sodium-ion batteries are starting to appear in grid storage applications. Their calendar aging behavior is not yet well characterized. Early data suggest that hard carbon anodes form a different kind of interphase than graphite does with lithium, and the temperature sensitivity may be different. Whether sodium-ion will prove more or less tolerant of poor storage conditions than lithium-ion remains an open question.
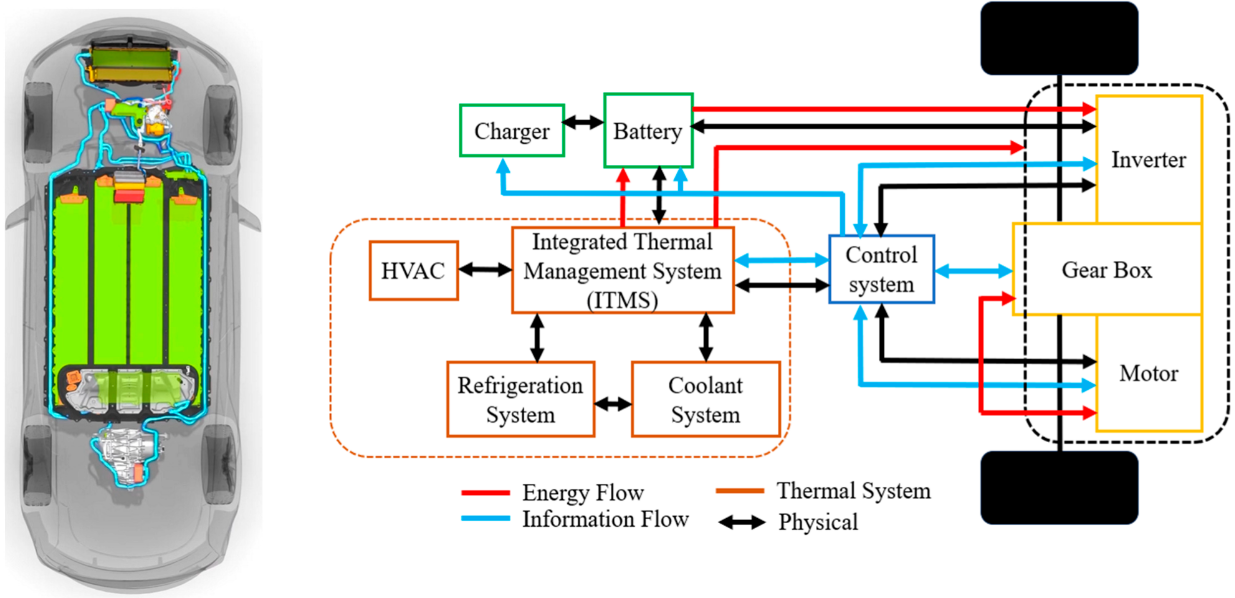
Large-format automotive battery packs, like this Tesla Model S unit, face complex thermal gradients that create non-uniform aging across thousands of individual cells.
SOC Is Overrated
Grolleau's 2014 study on calendar aging of EV cells found that temperature explained 75-80% of the variance in capacity fade, while SOC explained only 15-20%. The remaining variance came from cell-to-cell variation within batches.
That is worth repeating. Temperature explained four times as much of the aging as SOC did.
Raising storage temperature from 25°C to 45°C roughly quadruples the capacity fade rate. Raising storage SOC from 50% to 100% roughly increases fade rate by 50%. Temperature is the dominant variable by a factor of three or more.
The SOC effect comes from electrode potentials. High SOC means low anode potential (more driving force for electrolyte reduction) and high cathode potential (more driving force for electrolyte oxidation and transition metal dissolution). Low SOC means higher anode potential (less SEI growth) but eventually runs into copper dissolution risk below about 2V cell voltage. The copper current collector on the anode starts to oxidize and dissolve below about 1.5V anode potential, which corresponds to roughly 0-5% SOC depending on cell design. Dissolved copper migrates to the cathode and deposits there, which can cause short circuits on subsequent charging.
If temperature is controlled, aim for 40-60% SOC. If temperature is not controlled, do not waste time on precise SOC management. A battery at 50% SOC and 40°C will degrade faster than a battery at 90% SOC and 20°C.
Storing cells at 100% SOC is bad enough to partially offset temperature advantages. Storing cells below 10% SOC is dangerous enough (copper dissolution, risk of overdischarge during extended storage from continued self-discharge) that it should be avoided regardless of temperature. But within the normal 30-80% SOC range, temperature is what matters.
Some storage guidelines recommend topping up batteries periodically during long-term storage to prevent overdischarge. Whether this helps or hurts depends on the specifics. If the top-up is done at room temperature with a slow charger and returns the cell to 50% SOC, it is probably harmless. If the top-up is done with a fast charger immediately after removing the battery from cold storage, it may cause lithium plating. If the top-up brings the cell to 100% SOC "for safety margin," it will accelerate calendar aging during the next storage period.
Why Fluctuation Is Worse Than Heat
Carter's 2018 study: cells subjected to daily temperature cycles between 10°C and 40°C for six months versus cells held steady at 25°C (the same average temperature). The cycled cells showed 40% more capacity fade despite the identical average temperature. The additional fade came almost entirely from increased lithium inventory loss, consistent with accelerated SEI growth on freshly exposed surfaces.
A warehouse that holds steady at 30°C may produce better storage outcomes than one that cycles between 15°C and 25°C.
Thermal expansion mismatch between copper current collectors, aluminum current collectors, active material layers, and SEI creates mechanical stress during temperature cycling. Repeated cycling causes delamination and particle cracking. The fresh surfaces exposed by cracking undergo rapid SEI formation, consuming lithium inventory.
Condensation is the other fluctuation risk. When temperature drops through the dew point, moisture condenses on battery surfaces. Even small amounts of moisture hydrolyze the LiPF6 electrolyte salt, generating HF acid that attacks current collectors and active materials.
A battery pack with a 10°C gradient across it will develop non-uniform aging. Cells in the hot region lose capacity faster, which increases their internal resistance, which reduces their share of pack current. The other cells work harder and age faster to compensate. The pack eventually becomes limited by its worst cell, and the worst cell is almost always the one that ran hottest.
Packs stored on pallets in warehouses will have temperature gradients depending on their position in the stack. Packs on the outside of the pallet experience more temperature swing than packs in the middle. Over months of storage, these gradients accumulate into measurable cell-to-cell variation that was not present when the packs left the factory.
For pallet-scale storage, consider the thermal mass of the batteries themselves. A full pallet of cells takes hours to equilibrate with ambient temperature changes. This thermal inertia provides some protection against short-term temperature excursions but can also trap heat during sustained high-temperature periods. A pallet that enters a hot warehouse will warm gradually from the outside in, which means cells on the interior may experience different temperature histories than cells on the exterior.
Climate-controlled storage is not automatically uniform storage. Air conditioning systems create their own temperature gradients depending on where the vents are located, how the airflow interacts with the stored goods, and whether the system cycles on and off. A warehouse with aggressive temperature setpoint cycling to save energy may impose more thermal stress on stored batteries than a warehouse with looser temperature control but steadier conditions.
Humidity
That is the reaction that matters. The HF attacks aluminum current collectors (pitting corrosion), decomposes SEI layers, dissolves transition metal oxides in the cathode, and reacts with carbonate solvents to generate CO2 gas. Moisture content in commercial cells is controlled to below 20 ppm at manufacturing.
The aluminum current collector corrosion is particularly insidious because it can occur locally at points where the protective oxide layer is thin or damaged. Pitting corrosion creates high-resistance spots that generate heat during cycling, which can initiate thermal runaway in extreme cases. More commonly, pitting just increases cell impedance gradually until the cell fails to meet performance specifications.
Intact cell packaging provides good moisture barrier. Aluminum laminate films block water vapor reasonably well, with typical water vapor transmission rates around 0.01-0.1 g/m²/day depending on film construction. Metal cans are better by about two orders of magnitude. But once a cell has been cycled, microscopic cracks in the packaging or welds may allow slow moisture ingress. Used cells in high-humidity storage are more vulnerable than new cells in the same conditions.
Pouch cells are particularly susceptible. A pouch cell stored at 80% relative humidity for two years might absorb enough moisture to double its internal moisture content, which would significantly accelerate degradation on return to service. Vacuum-sealed bags with desiccant can help. Relative humidity below 50% is the target, with 40% being better and anything above 60% being a problem.
Higher temperatures increase the water vapor transmission rate through packaging materials, so hot and humid storage is worse than either factor alone would suggest. The Arrhenius activation energy for HF attack on aluminum is around 40 kJ/mol, similar to SEI growth, so moisture damage roughly doubles for every 10°C increase.
The Battery Was Old Before You Bought It
A laptop battery manufactured in January might sit in distributor inventory through the summer, ship to a retailer in September, sit on the shelf until the holiday shopping season, and finally reach a customer in December. That battery has experienced 11 months of calendar aging, including several months of potentially hot storage during summer, before the customer ever turns on the laptop.
Cell manufacturing includes formation cycling (initial charge-discharge to form the SEI layer) followed by aging and grading. The aging step typically lasts one to four weeks at elevated temperature (30-45°C) to accelerate any infant mortality failures and allow self-discharge screening. Cells with manufacturing defects will show abnormal voltage drop during this period and get rejected. The aging step is necessary for quality control, but it also consumes some of the cell's calendar life before it ever ships.
Cells then wait in inventory for pack assembly, which might take another few weeks. Pack assembly, testing, and shipment to distribution adds more time. Distribution to retail and shelf time in stores can add months. Total time from cell formation to customer delivery typically runs three to six months, sometimes longer.
Storage conditions during that period are often suboptimal. Cell warehouses at major manufacturers are usually climate-controlled, but distribution warehouses may not be. Shipping containers get hot. Retail stockrooms are rarely optimized for battery storage. The "new" battery a customer receives may have already lost a few percent of its capacity to calendar aging during the months between manufacturing and delivery.
Quality manufacturers screen for this with open-circuit voltage measurements before shipment. Cells with abnormal voltage drop get rejected. But normal calendar aging during the supply chain is simply absorbed as a cost of doing business.
When customers complain that their new device does not meet the rated battery life, supply chain aging is often the explanation. The battery met specifications when it left the cell factory. It did not necessarily meet specifications when it reached the customer. Manufacturers know this and set their initial specifications with some margin for supply chain losses, but unusually long supply chains or unusually hot storage conditions can exceed that margin.
Batch Variation
20-30% differences in calendar aging rate between nominally identical cells from different production batches. That is not a typo.
Raw material lots are one source. Active material particle size distribution affects surface area, which affects SEI formation rate. A batch of cathode material with slightly smaller particles will have higher surface area and faster calendar aging than a batch with larger particles, even if both batches meet the specification for particle size. Electrolyte purity affects side reaction rates. Binder molecular weight affects electrode mechanical properties and can influence particle cracking rates.
Process parameters are another. Coating thickness, calendering pressure, electrolyte fill volume, and formation protocol all affect cell performance. Process control keeps these within specification, but "within specification" still allows meaningful variation. A cell at the high end of the coating thickness specification will have different thermal characteristics than a cell at the low end.
Even with identical formulations, batch-to-batch variation in how thoroughly the electrolyte components are mixed can affect performance. Additives that are not fully dissolved or uniformly distributed will not provide their intended benefits uniformly throughout the cell.
For most applications, this variation disappears into the noise. The typical customer does not notice whether their battery loses 3% capacity per year or 4% capacity per year. For critical applications where batteries must meet specific lifetime requirements, batch-specific testing is necessary. Extrapolating from one batch to another is risky. Medical device manufacturers and aerospace companies typically qualify each production batch separately for exactly this reason.
The batch variation issue also affects research. Published studies on battery aging are typically conducted on a single batch of cells. Results may not generalize to other batches of the same cell model, let alone other cell models with similar specifications. Different research groups sometimes report conflicting results for what should be the same chemistry because they are testing different batches, possibly from different manufacturers, with different (undisclosed) electrolyte formulations.
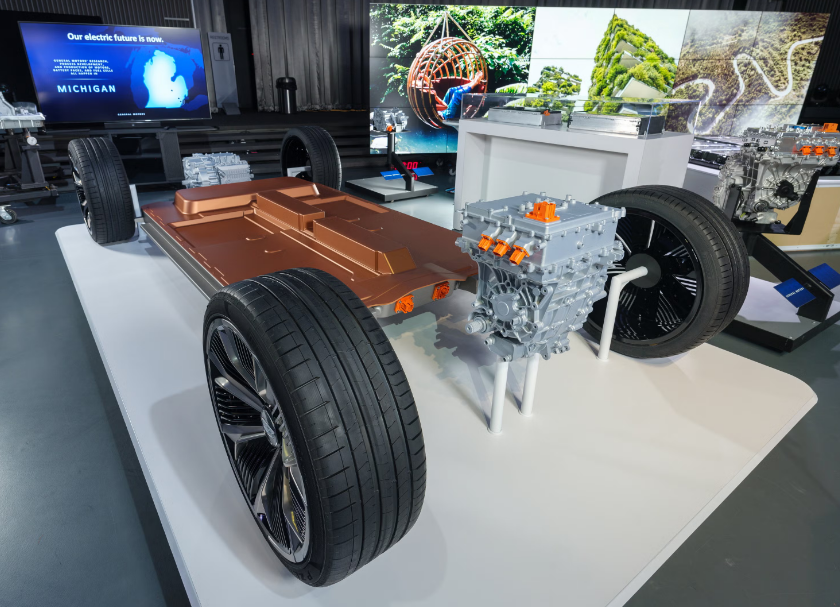
Modern electric vehicle battery integration demands precise thermal management
Datasheets Lie By Omission
Datasheet storage temperature ranges are conservative for liability reasons. A range of 0°C to 45°C usually means the true safe range extends somewhat beyond those limits. Manufacturers set specifications to cover worst-case scenarios: full charge, high humidity, temperature fluctuation, extended duration. Customers with better-controlled conditions have margin to work with.
The conservatism is asymmetric. High-temperature limits have more margin than low-temperature limits. Operating or charging at -10°C creates real risk of lithium plating. Operating at 50°C just accelerates aging. One causes immediate damage that may be irreversible; the other causes gradual damage that is more forgiving.
Electrolyte formulation affects temperature sensitivity as much as cell chemistry, but manufacturers do not disclose electrolyte details. Two NMC811 cells from different vendors may have dramatically different storage characteristics because of different additive packages. Vinylene carbonate improves high-temperature stability by forming a denser, more stable SEI. Fluoroethylene carbonate is necessary for silicon-containing anodes but accelerates gas generation at elevated temperature. Lithium bis(oxalato)borate improves high-voltage stability but increases low-temperature viscosity.
Propylene carbonate content matters too. PC improves low-temperature performance but can cause graphite exfoliation if the SEI is not properly formed. Different manufacturers use different PC levels depending on their target applications, and this affects storage behavior at temperature extremes.
The separator can also affect temperature sensitivity. Ceramic-coated separators have better high-temperature dimensional stability than uncoated polyolefin separators. Cells with ceramic-coated separators can tolerate brief temperature excursions better, but this is not reflected in datasheet specifications.
A cell from a premium manufacturer with optimized electrolyte and ceramic-coated separator may outperform a cheaper cell stored at lower temperature. The datasheet will not tell you this. Manufacturers treat electrolyte formulations as trade secrets.
The datasheet also will not tell you about the cell's history before it was tested. Manufacturer calendar aging data typically comes from cells that went directly from formation to testing under controlled conditions. A cell that spent three months in a non-climate-controlled distribution warehouse before reaching the customer will not match those results even if subsequent storage conditions are perfect.
Some manufacturers provide application-specific guidance beyond the datasheet. Automotive cells often come with detailed storage recommendations for vehicle assembly plants, including temperature limits, SOC targets, and maximum storage durations at each stage of the manufacturing process. Consumer cells rarely include this level of detail. If your application needs it, ask the manufacturer directly. They may have data they do not publish.
Calendar aging specifications, when they exist, are often stated as "capacity retention after X months at Y temperature and Z SOC." These single-point specifications hide significant variation. The specification might be met by 95% of cells in the batch while 5% fail. The specification might be based on testing one batch while your cells come from a different batch. The specification might be stated for ideal conditions while real-world conditions are worse.
How To Test If You Need To
Accelerated aging testing at elevated temperature is the standard method. Cells are stored at 40°C, 50°C, or 60°C and periodically tested for capacity and impedance. The results are then extrapolated to lower temperatures using Arrhenius models.
The extrapolation is imperfect. Degradation mechanisms can change at high temperatures, so accelerated aging at 60°C may not accurately predict behavior at 25°C. The standard practice is to test at multiple elevated temperatures (often 35°C, 45°C, and 55°C) and check whether the Arrhenius plot is linear. Curvature in the Arrhenius plot indicates that extrapolation will be unreliable.
Calendar aging tests also need to be conducted at multiple SOC levels to characterize the SOC dependence. Testing at 30%, 50%, 80%, and 100% SOC gives enough data points to fit a model of SOC influence.
The testing duration depends on the target lifetime. A rough rule of thumb is that accelerated aging should continue for at least 10% of the target lifetime at the accelerated temperature. For a battery intended for 10-year storage, that means at least one year of accelerated testing at elevated temperature. Shorter test durations can miss slow-developing failure modes.
Post-mortem analysis adds value to accelerated aging studies. Opening aged cells and examining the electrodes, electrolyte, and separator can reveal degradation mechanisms that are not apparent from capacity and impedance measurements alone. Scanning electron microscopy shows particle cracking and SEI morphology. Elemental analysis reveals transition metal migration and electrolyte decomposition products.
The cost of proper calendar aging characterization is not trivial. A thorough study requires dozens of cells, a year or more of testing time, specialized equipment for periodic measurements, and expertise in interpreting the results. For most applications, the cost is not justified. For applications where storage life is critical, the cost is much less than the cost of field failures.
One shortcut that sometimes works: if the same cell model has been in production for several years, someone has probably already done calendar aging testing. Cell manufacturers sometimes publish application notes with aging data. Academic researchers often publish studies on popular cell formats. Tesla and other EV manufacturers have collected massive datasets on real-world battery aging that occasionally leak into public discussions. The data may not be for exactly the storage conditions of interest, but it provides a starting point that can be extrapolated with appropriate caution.
Be wary of calendar aging data from cell manufacturers that looks too good. The cells used for manufacturer testing are often selected from the best batches, tested under ideal conditions, and measured with the most favorable protocols. Real-world storage with typical supply chain handling and typical environmental variations will produce worse results.
The Short Version
15°C. 40-60% SOC. Below 50% relative humidity. Stable temperature matters more than low temperature. Temperature matters more than SOC. Batteries age from the moment of manufacture. Different chemistries behave differently. Test your specific cells if storage life is critical.
15°C is where the electrochemistry wants you to be. Everything else is compromise.