 Energy Technology
What is a Power Battery?
Power battery. The phrase shows up everywhere in EV discussions. People use it interchangeably with "EV battery" or "traction battery" or just "the battery." What sets a power battery apart from the lithium cell in a phone or laptop comes down to engineering priorities. A smartphone battery optimizes for thinness and weight. A power battery optimizes for not killing anyone.
That sounds flippant. It is not. When a phone battery fails, the phone stops working. When a power battery fails at highway speed, outcomes range from inconvenient to fatal. This reality shapes every design decision.
How the Chemistry Works
Lithium ions move between two electrodes. Charging pushes them from cathode to anode. Discharging lets them drift back. The cathode gives up lithium according to:
The anode, usually graphite, tucks those ions between carbon layers.
Academic papers from the 1990s called this a "rocking chair" mechanism. The ions rock back and forth. The name never caught on commercially. Marketing departments prefer terms like "advanced lithium technology."
Cathode chemistry determines most of what matters about a battery cell. Two families dominate production lines today.
Lithium iron phosphate uses an olivine crystal structure. Iron sits in octahedral coordination within a phosphate lattice. The phosphorus-oxygen bonds hold together under abuse. Bond energy runs around 600 kJ/mol. Heat the cell to 500°C and the structure survives. Try the same with other chemistries and things come apart much sooner. This thermal tolerance made LFP the default choice for buses and commercial vehicles long before passenger car adoption accelerated.
The material has a history. John Goodenough's group at UT Austin identified the compound in 1996. Hydrothermal synthesis routes developed over the following decade made commercial production viable. BYD bet early on LFP when competitors chased higher energy density. The bet paid off.
LFP cells store 150-200 Wh/kg. For comparison, gasoline stores about 12,000 Wh/kg. The gap explains why EVs carry 400-600 kg of batteries to match the range of a 50 kg fuel tank. LFP's safety margin compensates for its energy penalty. Most Chinese EVs now run LFP. Cost helps too. Cathode material runs 33,000-35,000 RMB per ton.
Ternary chemistries pack more energy. NCM and NCA substitute nickel, cobalt, and manganese (or aluminum) for iron. Energy density climbs to 250-300 Wh/kg. The tradeoff shows up in thermal stability. These cathodes start decomposing around 200-250°C. The crystal structure also misbehaves during deep discharge cycles. NCM811 undergoes a phase transition (H2 to H3) where the lattice contracts along one axis. Mechanical stress builds. Cracks propagate. Capacity fades.
Three years ago, ternary cells dominated. Now LFP claims roughly 80% of Chinese EV sales. The shift happened faster than most analysts predicted. Charging infrastructure expansion reduced range anxiety. Price sensitivity did the rest.
The Automotive Difference
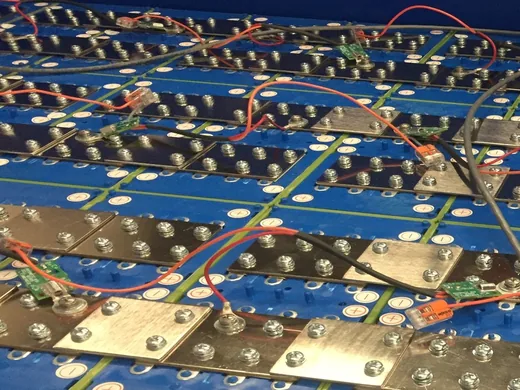
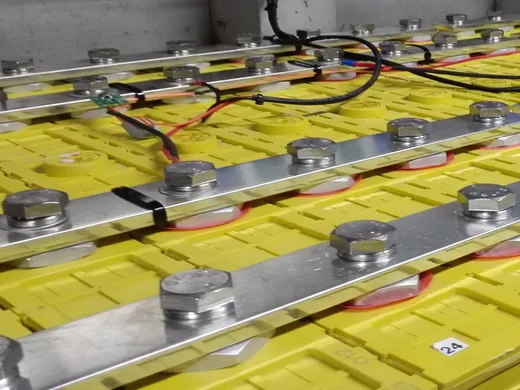
Phone batteries discharge at maybe 1-2 amps. Power batteries discharge at 200-400 amps continuously, with peaks above 1,000 amps during hard acceleration. A performance EV pulling 500 kW at 400V draws 1,250 amps. Smartphone cells would vaporize.
Electrode design enables these discharge rates. Thinner coatings mean shorter ion travel distances. Multiple tabs or continuous tab designs spread current collection across larger areas. Internal resistance drops. Heat generation drops with it.
Temperature creates problems at both extremes. Below -20°C, lithium ions move sluggishly through the anode structure. Charging too fast under these conditions plates metallic lithium on the graphite surface instead of intercalating properly. Dendrites form. Given enough cycles, dendrites puncture the separator. Internal short circuit. Thermal runaway. Fire.
Battery management systems restrict charging current in cold weather. Some vehicles run heaters to warm the pack before accepting charge. Tesla's preconditioning feature does exactly this when navigation targets a Supercharger. The energy spent heating the pack comes from the pack itself, reducing effective range in winter. Owners in cold climates know this tradeoff well.
Heat accelerates aging through different mechanisms. Electrolyte molecules decompose. The protective SEI layer on the anode thickens. Metal ions dissolve from cathode particles and deposit elsewhere. Calendar aging continues even when the battery sits unused. A battery stored at 40°C ages faster than one stored at 20°C, regardless of cycling. Arizona and Texas fleet data shows accelerated degradation compared to northern states. Test protocols cycle cells between -40°C and +85°C to simulate decade-long exposure in compressed timeframes.
Cycle life expectations differ by orders of magnitude from consumer electronics. A phone battery lasting 500 cycles serves adequately for a two-year device lifespan. Automotive warranties require 1,500-3,000 cycles minimum, often more for commercial vehicles, while retaining 80% capacity. Achieving this demands attention to manufacturing variables like electrode pressing force, electrolyte additive packages, and initial formation protocols. None of these matter much for phone batteries. The cost difference reflects this complexity. Power battery manufacturing lines run billions of dollars. Phone battery lines cost a fraction of that.
Formation cycling deserves mention. New cells undergo controlled charge-discharge sequences to build the initial SEI layer properly. The process takes hours or days per cell. Rushed formation produces inferior SEI. Inferior SEI means faster degradation. Manufacturers guard their formation recipes closely.
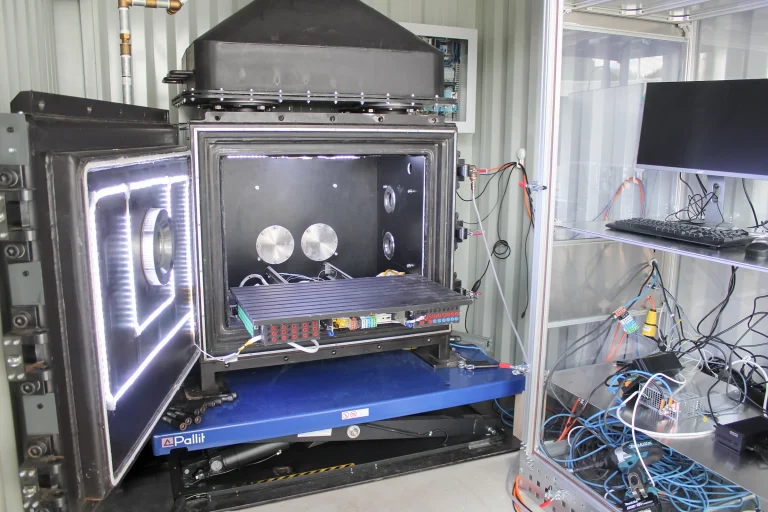
Safety testing reflects worst-case scenarios. Engineers drive nails through cells to simulate internal shorts. They crush cells to simulate crash damage. They expose cells to external flames. They submerge cells in water. They deliberately overcharge and over-discharge. Pack-level tests add drop impacts and vibration profiles matching actual road conditions.
Chinese regulators recently updated the national standard GB 38031-2025. Previous versions required batteries to provide warning before thermal runaway, giving occupants time to escape. The 2025 revision, effective July 2026, demands no fire and no explosion at all. Meeting this standard pushes cell and pack design toward more conservative operating envelopes.
Discharge Depth and Longevity
How deeply each cycle drains the battery affects how many cycles the battery survives. The math is not linear.
| Depth of Discharge | Expected Cycles | Total Energy Throughput |
|---|---|---|
| 10% DOD (Shallow) | ~15,000 cycles | Moderate |
| 50% DOD (Medium) | ~4,500 cycles | Peak efficiency |
| 100% DOD (Full) | ~1,500 cycles | High per-cycle, faster degradation |
Raw cycle count misleads. Multiply cycles by depth to get total energy throughput over battery life. This metric peaks somewhere around 50% DOD. Shallower cycling leaves energy on the table each cycle despite the wear imposed. Deeper cycling extracts more energy per cycle while accelerating degradation faster than the extraction rate compensates.
The degradation mechanisms differ by electrode. Deep discharge strips lithium from cathode crystals extensively. Beyond about 67% extraction in layered oxides, the structure destabilizes. Oxygen releases. Transition metals migrate. Particles crack and expose fresh surface to side reactions with electrolyte.
Anode degradation involves the SEI layer. This passivation film forms during first charge and ideally stays put. Deep cycling strains it mechanically as graphite expands and contracts with lithium content. The film cracks. Fresh film forms. Each reformation consumes lithium inventory and electrolyte. Irreversible capacity loss accumulates.
Discharge below cutoff voltage (2.5-3.0V for most chemistries) triggers additional problems. The copper current collector oxidizes. Dissolved copper migrates to the cathode and deposits as metal, creating conductive paths for self-discharge. A single deep over-discharge can cost 5-15% permanent capacity.
EV owners occasionally drain batteries completely by leaving vehicles parked for months. The resulting damage sometimes totals the car economically. Towing companies now carry portable chargers for exactly this reason.
Battery management systems guard against these failure modes through layered protections. Hardware circuits cut power when voltage drops too low. Software further constrains usable range. Dashboard readings of 0-100% typically map to 5-95% of actual physical capacity. Those hidden margins exist for good reason.
Industry Structure
Global power battery shipments hit 894.4 GWh in 2024. Chinese manufacturers controlled 67.1% of this volume. CATL alone claimed 37.9%.
CATL has held the top position for eight consecutive years. Current products include the Qilin pack architecture (255 Wh/kg system density through integrated cooling channels), the Shenxing LFP cell (4C charging, 400 km in 10 minutes), and a second-generation Shenxing promising 12C peak rates.
BYD ranks second globally with 17.2% share. The Blade Battery became famous after a 2020 video showing nail penetration without fire. Blade cells stretch up to 2,500 mm long, eliminating module packaging and achieving 60%+ space utilization in the pack. Fudi Battery, the BYD subsidiary producing these cells, supplies 95% internally while beginning external sales to Xiaomi, Changan, and FAW.
The strategic bet on ternary chemistry looked smart when energy density commanded premium pricing. It looks less smart now. LG Energy Solution led the Korean trio with 57.8% capacity utilization in 2024. Factories designed for higher volumes sat partially idle. Tesla's orders fell 41.1% as the automaker pivoted toward LFP and in-house 4680 production. SK On posted 1.127 trillion KRW losses. Samsung SDI redirected resources toward solid-state development, with pilot production targeted for September 2025. The Korean government launched support programs, worried about losing a strategically important industry. Whether subsidies can reverse market share losses remains uncertain.
Panasonic suffered the steepest decline among established players. Installations dropped 18% year-over-year. Heavy dependence on Tesla created vulnerability as Tesla diversified suppliers.
Technology Direction
Solid-state batteries remain the presumed successor technology. Replace liquid electrolyte with solid material and several problems potentially solve themselves. Organic solvents burn. Solid electrolytes do not. Lithium metal anodes enable 500+ Wh/kg energy density. Solid electrolytes might tolerate lithium metal where liquids cannot. SEI instability originates from liquid-solid interfaces. Remove the liquid and interface chemistry changes.
Three solid electrolyte families compete. Sulfides conduct ions almost as well as liquids (10⁻³ to 10⁻² S/cm). Exposure to moisture produces hydrogen sulfide gas. Current pricing runs around 70,000 USD/kg. Manufacturing requires dry rooms with moisture levels measured in parts per million. Oxides tolerate air better and struggle with interfacial resistance. Getting oxide electrolyte to bond properly with electrode materials remains an unsolved engineering problem at scale. Polymers process easily and conduct poorly at room temperature. Heating the cell improves conductivity, creating design complications for thermal management.
Chinese companies mostly pursue oxide-based semi-solid approaches as intermediate steps. These keep some liquid to manage interfaces while incorporating solid components for safety gains. NIO's 150 kWh pack in the ET7 uses WeLion semi-solid cells at 360 Wh/kg.
Timeline estimates vary widely. CATL rates its solid-state program at 4 on a 9-point readiness scale, targeting 7-8 by 2027. Toyota projects solid-state vehicles by 2027-2028. Toyota has made similar projections before. Industry observers remain skeptical.
Sodium-ion addresses raw material constraints rather than performance limits. Sodium abundance exceeds lithium by 400-fold. Supply chain concentration risks disappear. Lithium extraction concentrates in Australia, Chile, and China. Sodium comes from everywhere.
CATL's second-generation sodium cells reach 200 Wh/kg, adequate for city vehicles and stationary storage. Cold performance actually surpasses lithium-ion. Sodium cells operate at -40°C where lithium struggles. Commercial deployments started in 2025, initially in two-wheelers and grid storage. The technology fills niches where LFP's cold-weather limitations create problems.
Regulatory Environment
The EU Battery Regulation took effect August 2023. Carbon footprint declarations become mandatory for EV batteries in February 2025. Digital passports follow in February 2027, using QR codes to provide chemistry, capacity, and supply chain data. Carbon footprint thresholds arrive in 2028. Material recovery targets in 2031 require 80% lithium recovery and 95% cobalt/nickel recovery from retired batteries.
U.S. policy operates differently. The Inflation Reduction Act ties $7,500 EV tax credits to domestic content rules. Critical mineral sourcing from North America or allies must reach 60% in 2025, 80% by 2027. Battery component requirements follow similar schedules. Foreign Entity of Concern provisions effectively bar Chinese companies from direct supply chain participation. Workarounds exist. CATL's technology licensing deal with Ford for a Michigan plant demonstrates one approach.
Chinese policy shifted from purchase subsidies toward recycling and safety. New recycling regulations effective April 2026 establish digital battery identities and producer responsibility rules. Formal recycling captured only 30% of the 580,000+ tons reaching end-of-life in 2023. The rest went to informal channels or sat in warehouses. Room for improvement exists. Companies like GEM and Brunp (a CATL subsidiary) built industrial-scale hydrometallurgical recovery operations. Lithium recovery rates exceed 90%. Nickel and cobalt recovery exceeds 98%. The economics work when raw material prices stay high. Price collapses complicate the business case.
Pack prices dropped from $150/kWh in 2022 to $111/kWh by late 2024. Chinese LFP cells now sell around $52-54/kWh at cell level. Some industry sources report even lower spot prices during oversupply periods. Projections suggest $80/kWh pack pricing by 2026. At that point, EVs reach manufacturing cost parity with combustion vehicles before subsidies. The price decline accelerated faster than most forecasts predicted five years ago.
The core technology works. Current lithium-ion batteries propel vehicles hundreds of kilometers, survive thousands of cycles, and rarely catch fire. Bottlenecks moved elsewhere. Charging infrastructure needs buildout. Public charging networks remain sparse outside major urban corridors. Grids need capacity upgrades. Raw material supply chains need diversification. Recycling systems need scaling.
Solid-state might arrive in 2027. Or 2030. Or later. The current battery generation already enables mass electrification. Better batteries would help. They are not the constraint.
相关主题文章 (See Also):