
A 2019 paper in Nature Energy changed how researchers think about battery degradation. Severson and colleagues at Stanford and MIT fed early-life charging data into machine learning models and found they could predict which cells would fail early with startling accuracy. The cells were manufactured identically. The difference was charging protocol.
The battery industry has not absorbed the implications. Manufacturers continue quoting cycle life numbers from laboratory tests at 25°C with 0.5C charge rates. Field installations see temperature swings from -10°C to 50°C and charge rates pushed to 1C or higher for convenience. The gap between rated performance and field performance runs 2-4x in most real-world studies.
Nobody benefits from explaining this clearly. A customer who understands charging physics might extract 12 years from a pack rated for 5 years. The replacement sale disappears.
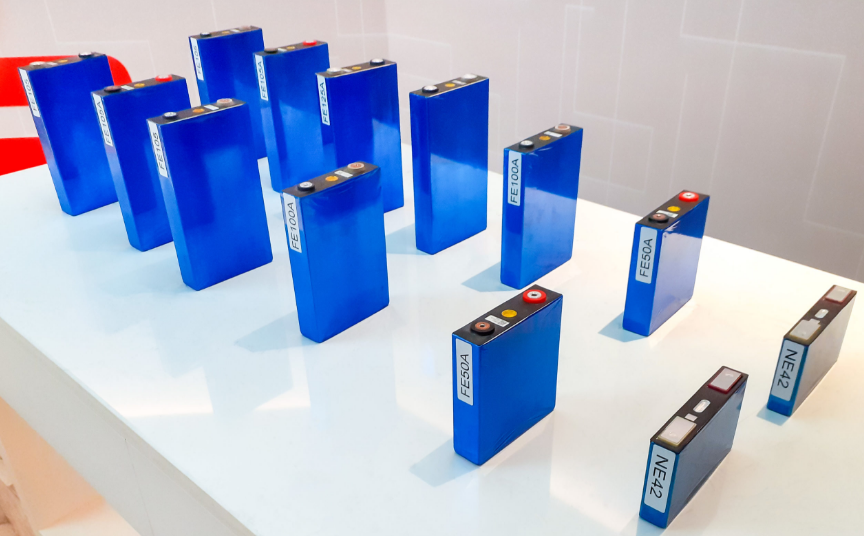
Modern lithium-ion battery cells
Lithium Plating: The Damage You Cannot See
Fast charging destroys batteries through a mechanism that remains invisible until failure.
Lithium ions arriving at the graphite anode must diffuse into the particle interior to intercalate properly. At high charge rates, ions arrive faster than they can diffuse. The particle surface saturates. Incoming ions have nowhere to go. They deposit as metallic lithium on the particle surface.
Voltage measurements cannot detect this. The cell voltage looks normal. The BMS reports healthy operation. Capacity measurements may show only minor fade initially. But each fast charge deposits more metallic lithium. The plated lithium reacts with electrolyte, consuming both. Dendrites can grow through the separator and cause internal shorts.
Argonne National Laboratory published photographic evidence of lithium plating in cells that showed minimal capacity fade on standard testing (Jansen et al., Journal of the Electrochemical Society, 2007). The cells looked fine by every metric until they were cut open.
Temperature makes plating worse. At 25°C, a cell might tolerate 1C charging without significant plating. At 10°C, the same charge rate causes severe plating. Electrolyte conductivity drops in cold conditions, creating a bottleneck at the anode surface. Most BMS systems restrict charging below 0°C, but the danger zone extends well above freezing.
The voltage window makes detection difficult. Plating begins when local anode potential drops below 0V versus lithium metal. But BMS systems measure full cell voltage, not anode potential. A cell at 3.8V total might have regions of the anode below 0V where plating occurs. High charge rates create potential gradients across thick electrodes. The outer surface of the anode reaches low potential while the inner regions remain safely above.
Pulse charging protocols attempt to address this. Short charging pulses followed by rest periods allow surface lithium concentration to equalize before the next pulse. The technique reduces plating at a given average charging rate. Some commercial BMS systems implement pulse charging, though the added complexity increases cost. Whether the cycle life improvement justifies the cost depends on how aggressively the system would otherwise be charged.
Recovery from plating damage is impossible. Plated lithium reacts irreversibly with electrolyte to form solid products. The lithium and electrolyte are permanently consumed. Unlike some other degradation modes, plating cannot be reversed through rest, reconditioning, or thermal treatment. Prevention through conservative charging is the only defense.
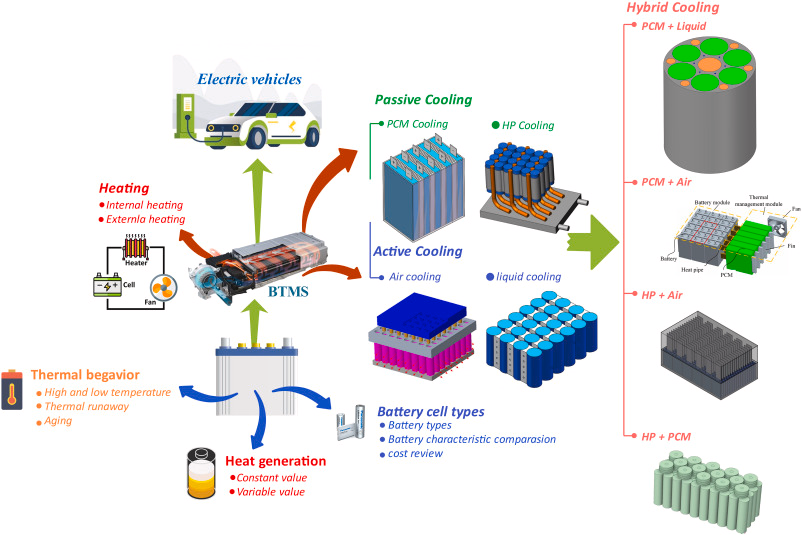
Temperature management remains one of the most critical factors in battery longevity
Temperature and the Arrhenius Trap
The Arrhenius equation governs reaction rates in electrochemistry. Degradation reactions roughly double for every 10°C temperature increase. A battery at 35°C degrades twice as fast as one at 25°C. At 45°C, four times faster.
The exponential relationship means temperature extremes matter more than averages. Fifteen days at 45°C causes more damage than 350 days at 25°C, despite similar average temperature over the year. Summer heat waves in unconditioned spaces can consume more battery life than years of moderate operation.
A study by Waldmann et al. (Journal of Power Sources, 2014) tracked degradation mechanisms across temperature ranges and found calendar aging dominated over cycle aging in many real-world scenarios. Batteries sitting at high temperature and high state of charge degraded from calendar effects even without being cycled. The warranty claims often blamed cycle life when calendar aging was the actual failure mode.
Thermal gradients within packs create additional problems. Cells in the center run hotter than cells on the edges. Differentials of 8-12°C within a single pack are common without active thermal management. The hot cells degrade faster, creating progressively worse capacity imbalance. The pack becomes limited by its weakest, hottest cell.
The interaction between temperature and state of charge matters too. High temperature damages batteries more at high state of charge than at low state of charge. A battery stored at 100% SOC and 40°C degrades roughly three times faster than one stored at 50% SOC and 40°C. Solar installations that maintain batteries at full charge during hot summer days accumulate accelerated damage.
Geographic location determines thermal exposure. An installation in Phoenix sees very different conditions than one in Seattle. The same battery hardware, same charging algorithm, same usage pattern will show vastly different lifespans. A 2021 NREL study found that identical residential systems in hot climates showed 40% greater capacity fade after five years compared to temperate climate installations.
Active thermal management changes the economics. Liquid cooling maintains temperature within a narrow band regardless of ambient conditions or charging load. The cooling system adds $50-100/kWh to system cost. Whether that cost is justified depends on climate and usage. In Phoenix, active cooling may double battery lifespan. In Seattle, the payback may never materialize.
The decision matrix is rarely presented to customers. Installers in hot climates often sell systems without active cooling because cooling adds cost and complicates installation. The battery warranty covers the same period regardless. The customer discovers the temperature problem when the battery fails at year 4 instead of year 10.
Solid-State: A Decade of Broken Promises
The battery industry has promised solid-state commercialization since at least 2015. Each year brings announcements of production "in 2-3 years." Each year the timeline slips. Toyota showed prototype vehicles in 2023 and pushed mass production to 2027-2028. QuantumScape ships samples but has not demonstrated manufacturing yields.
The technology works in labs. It does not work in factories. Betting on solid-state availability before 2030 is inadvisable.
Silicon Anodes Are Mostly Marketing
Silicon stores ten times more lithium than graphite per unit mass. Every battery company mentions it. But silicon expands 300% when lithiated. It cracks. Early silicon cells failed within dozens of cycles.
Current commercial cells contain 3-8% silicon by weight. Energy density improves 5-15%. Tesla's 4680 cells have about 5-10% silicon according to teardowns, comparable to competitors. The energy density gains come from cell format, not anode chemistry.
"Silicon anode technology" in marketing usually means incremental improvement dressed as transformation.
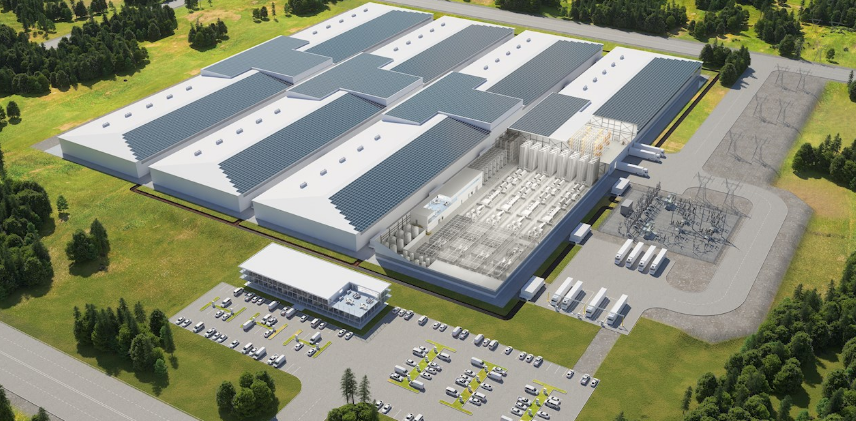
Large-scale battery manufacturing
The Warranty Game
Battery warranties protect manufacturers more than customers.
A 10-year warranty typically covers prorated replacement based on age. A battery failing at year 6 might receive 40% credit toward replacement. The customer pays 60% plus installation. The warranty provided partial protection, not full replacement.
Temperature exposure violations are common but difficult to prove. A battery rated for -20°C to 50°C may have degraded from sustained exposure to 55°C during a heat wave. Without continuous temperature logging, the customer cannot prove compliance. The manufacturer cannot prove violation. The claim often goes unresolved, with the customer bearing the cost.
Charger compatibility requirements sometimes appear after product launch. A manufacturer may specify compatible chargers only after fielding warranty claims from incompatible equipment. Customers who purchased before the specification face claim denial for charging-related failures.
Documentation practices determine outcomes as much as actual installation quality. A properly installed system without commissioning records faces the same challenges as an improper installation. Photographs, test records, and temperature logs provide evidence in disputes. Installations by uncertified contractors rarely include this documentation.
The fine print matters. Some warranties exclude "damage from environmental conditions." Some exclude "damage from improper charging." Some exclude both. A battery that fails from overheating during summer fast-charging might be excluded on multiple grounds. The marketing says "10-year warranty." The legal document says something else.
Class action lawsuits against battery manufacturers have emerged in recent years. The complaints allege misleading cycle life claims, inadequate disclosure of temperature sensitivity, and denial of valid warranty claims. Whether these suits succeed will shape industry practices. For now, customers should read the full warranty document, not the marketing summary.
NFPA 855 and the Cost Nobody Mentions
Commercial battery installations face fire safety requirements that residential installations often ignore.
NFPA 855 requires fire-rated separation from other building areas for systems exceeding 20kWh. Systems exceeding 50kWh require suppression systems designed for lithium battery fires. Conventional water-based suppression may not extinguish lithium fires. Clean agent systems using fluoroketone compounds (Novec 1230 or equivalent) are typically specified.
The cost of compliant fire suppression often exceeds the cost of the batteries themselves for mid-sized commercial installations. A 100kWh commercial installation might budget $25,000 for batteries and discover $40,000 in fire suppression requirements during permit review. The surprise changes project economics after contracts are signed.
UL 9540 certification increasingly determines insurance coverage. The certification includes fire testing under UL 9540A, which initiates thermal runaway and measures propagation. Systems lacking certification face coverage exclusions or premium surcharges that affect project economics.
Permitting timelines stretch 6-12 months in major metropolitan areas. Engineering documentation, structural analysis, electrical coordination studies, and environmental review all require time. Projects scoped without adequate permit budget and timeline face delays that undermine financial models.
The enforcement varies by jurisdiction. Some fire marshals require strict NFPA 855 compliance for any commercial installation. Others focus only on large installations. Some residential installations technically exceed thresholds but receive no scrutiny. The inconsistent enforcement creates confusion about what is actually required. Asking the local authority having jurisdiction before purchasing avoids expensive surprises.

Grid-scale energy storage installations face complex regulatory requirements that often surprise project developers
What Machine Learning Actually Does for Batteries
The marketing claims "AI-powered charging" without specifying what algorithms accomplish.
The legitimate applications are narrower than the hype suggests. State of charge estimation benefits from machine learning. Traditional coulomb counting accumulates errors. Voltage-based estimation is confounded by temperature, hysteresis, and aging. Machine learning models trained on battery data account for these factors and improve accuracy. Real improvement, but incremental.
Degradation prediction showed promise in the Severson study. Early-life charging curves contained signatures predictive of eventual failure. Models identified patterns invisible to physics-based analysis or human experts. Applied to field data, such models could provide early warning of batteries heading toward failure.
The practical challenge is training data. Accurate models require large datasets of complete battery lifecycles. Laboratory datasets exist. Field datasets covering diverse conditions and full lifetimes are scarce. Models trained on controlled laboratory cycling may not generalize to field operation with temperature variation, partial cycling, and irregular use.
Claims that AI improves charging efficiency by double-digit percentages should be viewed skeptically. The physics of lithium-ion charging leaves limited room for improvement. Constant current bulk charging followed by voltage-limited absorption is already close to optimal. Algorithms might squeeze out a few percentage points. Dramatic gains from software alone are implausible.
The venture capital pitch differs from the engineering reality. "AI-powered battery management" attracts investment. The underlying algorithms are often simple lookup tables or polynomial fits dressed in machine learning terminology. Actual neural networks require training data that early-stage companies do not have. The gap between marketing claims and technical substance is wide.
Some legitimate innovation exists. Adaptive algorithms that learn individual battery behavior and adjust parameters over time can improve on static default settings. Anomaly detection that flags unusual behavior for investigation catches problems that rule-based systems miss. But the improvements are incremental, not dramatic. A well-tuned conventional BMS performs within a few percent of the fanciest ML system.
The IRA Changed Everything
The Inflation Reduction Act of 2022 restructured battery economics for installations in the United States.
Standalone energy storage became eligible for investment tax credit for the first time. Previously, storage qualified only when paired with solar. The standalone ITC started at 30% for projects meeting prevailing wage and apprenticeship requirements. Bonus credits for domestic content and energy community locations can push total credits above 50% of installed cost.
The math shifted overnight. A $100,000 battery installation receiving a 50% credit has an effective cost of $50,000. The same installation before IRA had an effective cost of $100,000. Projects that made no financial sense in 2021 became attractive in 2023. Deployment accelerated dramatically.
Domestic content requirements created supply chain complications. Cell manufacturing capacity in the United States has expanded but has not caught up with demand from ITC-incentivized projects. Projects seeking maximum credits face tradeoffs between product availability, domestic content qualification, and timeline.
Prevailing wage requirements apply to projects above 1MW. Smaller projects receive reduced credits (6% base versus 30%) unless they meet labor requirements. Some projects are now designed to stay below 1MW to avoid wage requirements. The threshold created a cliff that distorts project sizing decisions.
The domestic content calculation methodology evolved through Treasury guidance over 18 months. Initial rules were unclear. Projects that began construction early faced uncertainty about whether they would qualify. Later guidance clarified calculations but also revealed that many assumed-domestic products did not actually qualify. The moving target complicated procurement.
Transfer and direct pay provisions changed project finance. Tax credits can transfer to third parties at a discount, typically 90-95 cents on the dollar. Tax-exempt entities can receive credit value as cash through direct pay. The mechanisms expanded viable project sponsors beyond traditional tax equity investors who could use the credits directly.
Bonus credits stack in ways that require careful planning. Energy community bonus (10%), domestic content bonus (10%), and low-income community bonus (10-20%) can combine with the base 30% credit. But each bonus has different qualification requirements and documentation needs. Missing one qualification requirement forfeits that bonus. The complexity creates an industry of IRA consultants.

The transition to renewable energy has accelerated dramatically with new policy incentives
The Numbers Behind Levelized Cost
Battery economics calculations routinely use assumptions that do not survive field conditions.
Cycle life claims drive levelized cost of storage calculations. A battery rated for 5,000 cycles appears to offer 5,000 × 80% = 4,000 equivalent full cycles. But the 5,000 cycle rating assumes laboratory conditions. Real-world cycle life varies by factors of 2-4x depending on charging methodology, temperature, and usage. Levelized cost calculations should use realistic expectations, not nameplate ratings.
Round-trip efficiency affects economics more than commonly appreciated. Typical efficiency runs 85-92%. Every cycle loses 8-15% of stored energy as heat. Over ten years of daily cycling, efficiency losses consume 25-40% of total throughput. Calculations assuming 100% efficiency overstate returns correspondingly.
Efficiency declines with age. A system starting at 92% efficiency may decline to 85% after five years as internal resistance increases. Degradation calculations using constant efficiency understate total losses.
Residual value after warranty provides unexpected economics. Batteries reaching 80% capacity retention often have substantial remaining life at reduced capacity. Applications with lower requirements can extract additional value from degraded batteries. Some cells reach 60% retention after twice their warranted cycle count. The 80% threshold is a warranty definition, not a failure point.
The installed cost structure hides where money goes. A residential system selling for $800/kWh installed might include $120/kWh of cells, $80/kWh of power electronics, $100/kWh of enclosure and thermal management, $150/kWh of installation labor, $100/kWh of permitting and design, and $250/kWh of margin distributed across the supply chain. Cell cost is 15% of installed cost. Cell cost reductions pass through to end customers slowly.
Financing costs add another layer. A system financed over 10 years at 8% interest costs 40% more than the cash price after interest payments. Lease structures may include escalation clauses that increase payments over time. The monthly payment that looks affordable in year one becomes burdensome in year eight. Most economic analyses quote cash prices, not financed total cost of ownership.
Time-of-use arbitrage revenue depends on rate spreads that utilities control. A 20-cent spread between peak and off-peak rates makes arbitrage attractive. Utilities in battery-heavy markets have begun reducing rate spreads, compressing arbitrage revenue. A system sized for today's rates may underperform under tomorrow's rates. The regulatory risk rarely appears in economic projections.
Maintenance Is Not Zero
Manufacturers claim "maintenance-free" compared to lead-acid. Technically true. But cells drift apart and need balancing. Capacity fades invisibly and needs testing. Firmware has bugs that need patching. Connections loosen and corrode.
A 20kWh residential system might need 4-6 hours of professional attention annually. Not zero.
What the Technology Cannot Do Yet
Energy density improvements have slowed. The dramatic gains of 2010-2020 came from engineering: thinner separators, adjusted porosity, reduced inactive materials. Physics limits further gains within existing chemistry. Incremental improvement continues at 3-5% annually. Major improvement requires new chemistry not yet commercially mature.
Power and energy density remain tradeoffs. High-power cells sacrifice energy density. High-energy cells sacrifice power capability. No product does both well.
Calendar aging continues regardless of usage. Batteries on shelves lose capacity. Full charge accelerates calendar aging. High temperature accelerates calendar aging. Products may spend months in distribution before reaching customers. Manufacturing date matters but is not always disclosed.
Cold weather performance remains challenging. Charging below 0°C risks lithium plating. Heating systems maintain temperature but consume energy. Northern climates require either active heating or acceptance of reduced winter capability.
Safety incidents continue despite improved designs. Battery fires make headlines because they are rare, but consequences are severe. Better cell design, more robust BMS, and better integration have improved safety but not eliminated risk.
References
Severson, K.A., et al. "Data-driven prediction of battery cycle life before capacity degradation." Nature Energy 4 (2019): 383-391.
Jansen, A.N., et al. "Development of a high-power lithium-ion battery." Journal of the Electrochemical Society 154 (2007): A1040-A1048.
Waldmann, T., et al. "Temperature dependent ageing mechanisms in Lithium-ion batteries." Journal of Power Sources 262 (2014): 129-135.
National Renewable Energy Laboratory. "Life Prediction Model for Grid-Connected Li-ion Battery Energy Storage System." Technical Report NREL/TP-5D00-67102 (2017).
Internal Revenue Service. "Notice 2024-30: Energy Community Bonus Credit Amounts under the Inflation Reduction Act of 2022."
UL Standards. "UL 9540: Energy Storage Systems and Equipment." 2020.
National Fire Protection Association. "NFPA 855: Standard for the Installation of Stationary Energy Storage Systems." 2023 Edition.