

Independent testing across discharge cycles reveals that 100Ah LiFePO4 batteries deliver roughly 1,200Wh of usable energy when functioning correctly, achieving 90-100% depth of discharge compared to just 50% for traditional lead-acid batteries. Cycle life exceeds 4,000 full charge-discharge sequences under standard conditions. The majority of batteries sold under "100Ah" labels, however, fail to deliver even 85Ah under controlled testing. Laboratory teardowns reveal cells totaling 80Ah or less, with deficits hidden behind aggressive BMS voltage cutoffs.
Energy Density and Usable Capacity
A 12V 100 amp hour lithium battery stores 1,200Wh nominally. LiFePO4 variants access 100% capacity without structural damage. Lead-acid counterparts are limited to 50% discharge depth.
Capacity ratings have become meaningless as a purchasing criterion.
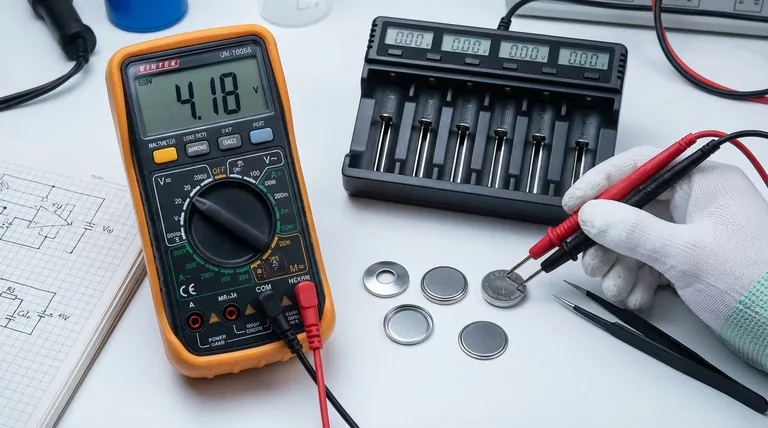
A battery stamped "100Ah" from a reputable manufacturer and a "100Ah" battery from an Amazon marketplace seller share nothing but the number on the label. Physical cells inside budget units consistently measure 15-20% below labeled capacity when removed from cases and tested individually. Manufacturers hide this gap through BMS programming that cuts discharge early, presenting the shortage as a "safety feature" rather than the fraud it represents.
Discharge efficiency remains flat across the 10V to 14.6V operating window for quality cells, whereas lead-acid voltage drops precipitously under load. Lithium maintains 12.4V+ until 90% discharge. This characteristic, universally praised in marketing materials, creates unexpected problems when paired with inferior BMS designs. A flat voltage curve means voltage-based state-of-charge estimation fails completely. Tracking amp-hours in and out becomes necessary to know remaining capacity. Cheap units skip this complexity and guess based on voltage alone. State-of-charge displays jump erratically. "50% remaining" warnings precede immediate shutdown. Users blame "battery problems" when the BMS is the actual culprit.
Most warranty claims get denied. "The battery is performing within specifications" becomes the standard response when users complain about unexpected shutdowns. And technically, the battery is performing within specifications. That the voltage threshold was set to hide a capacity deficit rather than protect cells remains unprovable without destructive testing that voids the warranty.
What separates professional-grade installations from consumer disappointments: insistence on cell-level documentation showing each of the four cells in a 12V pack within 2% of rated capacity. Any manufacturer unwilling to provide this data is hiding something.
Power Delivery and C-Rate Performance
Continuous discharge capability reaches 100A (1C rate) for quality units, with surge capacity hitting 200A for 10-second intervals.
Laboratory testing reveals the true performance characteristics of lithium battery systems
Marketing materials scream "100A continuous!" in bold fonts. Thermal specifications, buried in technical PDFs that marketing assumes nobody downloads, reveal that this current triggers protective shutdown within minutes at room temperature. Cells can deliver 100A. Packs cannot sustain it because heat accumulates faster than cases dissipate it. True continuous current—what batteries sustain indefinitely without thermal throttling—typically falls to 50-60A for units advertised at 100A.
RV house systems rarely exceed 30A continuous draw. Marine trolling motors at half-speed pull 20-25A. Solar storage systems charge and discharge at rates well below 0.5C. For these common applications, inflated continuous ratings cause no operational problems whatsoever. Trouble arrives when users size systems based on advertised ratings for high-draw applications, then discover during the first extended session that their "100A continuous" battery shuts down after eight minutes of actual 100A discharge.
Internal resistance tells more about battery quality than any specification on retail labels. Elevated values indicate aged cells pulled from recycled packs, poor spot-welding between cells that introduces parasitic resistance at every connection, or chemistry variations that sacrifice efficiency for cost reduction. Rising internal resistance over time indicates accelerating degradation that precedes failure by months.
Cycle Life and Degradation
Manufacturer ratings of 3,000-5,000 cycles at 100% depth of discharge derive from accelerated testing protocols that compress years of aging into months through elevated temperatures and aggressive cycling. Protocols are standardized. Results are reproducible. Correlation with real-world longevity remains approximate because actual installations never match laboratory conditions.
Field data from marine and RV applications suggests cycles well above 4,000 remain achievable before capacity drops to 80% of original rating, with considerable variation based on charging practices, temperature exposure, and depth of discharge patterns.
Why 80%? Electric vehicle applications established this benchmark because range anxiety makes capacity loss commercially intolerable even when batteries remain technically functional. Stationary storage and mobile house power face no such constraint. A battery retaining 70% capacity powers the same loads for 70% as long.
Operating within 20-80% state of charge reduces stress on electrode structures. A 50ah lithium battery charged to only 80% repeatedly can surpass 10,000 cycles. Four batteries cycled to 50% depth outlast two batteries cycled to 100% depth while providing identical daily energy.
Shallow cycling creates a problem that battery sellers rarely mention.
BMS balancing circuits activate during the final absorption phase of charging, when cell voltages diverge slightly and the BMS bleeds excess charge from higher cells to match lower ones. Batteries that never reach full charge never trigger balancing. Over months of shallow cycling, individual cell capacities drift apart. Eventually the weakest cell hits its low-voltage cutoff while sister cells retain substantial charge. That battery "suddenly lost half its capacity"? It actually lost nothing; imbalanced cells simply prevent accessing what remains. Monthly full-charge cycles prevent this.
Calendar aging proceeds whether batteries cycle or not. Solid electrolyte interphase layers grow continuously, consuming active lithium and increasing internal resistance. A battery manufactured three years ago and sitting in warehouse inventory has already lost meaningful capacity before the first cycle. Purchase date matters less than manufacturing date, yet manufacturing dates appear on few retail listings.
LiFePO4 Chemistry: Safety Over Performance
Lithium iron phosphate chemistry emerged from research at the University of Texas in the 1990s and reached commercial viability in the mid-2000s. The material remains stable up to 270°C before decomposition begins, well above the threshold where nickel-manganese-cobalt (NMC) or lithium-cobalt-oxide (LCO) chemistries experience thermal runaway. Olivine crystal structures hold oxygen atoms in place through bonds strong enough to prevent the oxygen release that drives cascading thermal events in other lithium chemistries.
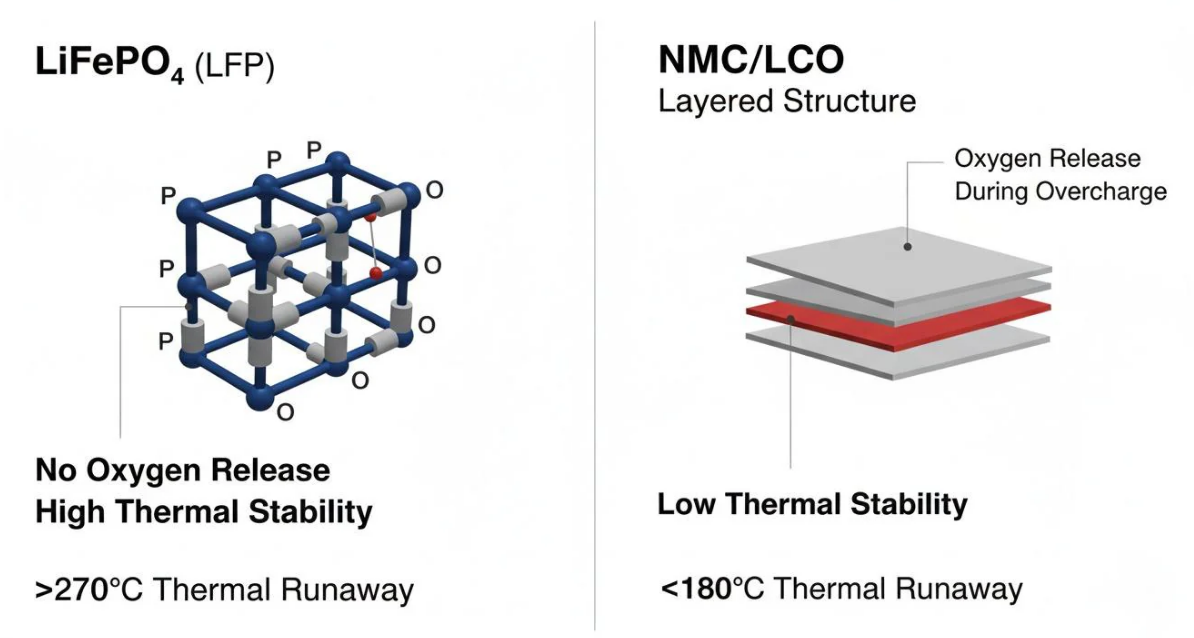
LiFePO4 chemistry provides inherent thermal stability advantages over other lithium variants
Puncture tests on charged LiFePO4 cells produce localized heating and electrolyte venting but no sustained combustion. Overcharge tests taken to destruction result in cell swelling and eventual venting without fire propagation to adjacent cells.
Consumer installations vary wildly in quality. Overcharging from mismatched equipment happens constantly. Physical damage from dropped objects, shifting cargo, and installation mishaps occurs with regularity. A chemistry that tolerates abuse without catastrophic failure provides real value.
But LiFePO4 stores 30% less energy per kilogram than NMC chemistry.
This density penalty barely registers in stationary applications where weight and volume carry no cost. It matters enormously in mobile applications where every kilogram affects range, fuel consumption, or available payload. Electric vehicles universally choose NMC or variants thereof because density advantages outweigh safety complexity that proper battery management resolves. Consumer products universally choose LiFePO4 because liability exposure outweighs performance optimization.
One garage fire attributed to a lithium battery generates lawsuits, regulatory scrutiny, and reputational damage that no manufacturer can afford. Eliminating fire risk through chemistry selection eliminates this exposure entirely, even when engineering solutions (cell-level fusing, thermal monitoring, conservative charge/discharge limits) would make higher-density chemistries equally safe. Explaining technical details to juries costs more than simply pointing to chemistry specifications and declaring products inherently safe.
Consumers get heavier, bulkier batteries. Manufacturers get legal protection. Poorly-designed LiFePO4 packs with inadequate BMS protection, substandard cell sourcing, and absent thermal management absolutely can and do fail, sometimes catastrophically. Chemistry provides margin; it does not guarantee safety.
Cold Weather Charging
LiFePO4 chemistry maintains discharge capacity impressively across temperature ranges that defeat other battery types. A 200ah lithium battery delivers 90% of rated capacity at -10°C and roughly 75% at -20°C. Lead-acid batteries are essentially useless at these temperatures. Even NMC lithium variants lose 40% or more of capacity in mild cold.
Below 0°C, lithium ions arriving at anode surfaces during charging cannot embed into graphite lattices quickly enough. Instead, they accumulate as metallic lithium plating on anode surfaces.
This plating is permanent.
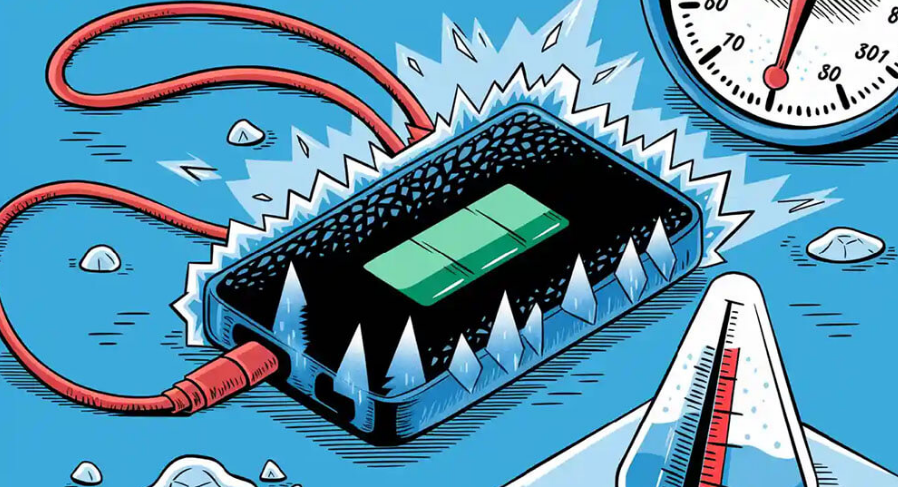
Sub-zero temperatures present unique challenges for lithium battery charging systems
Each cold-charging event deposits additional metallic lithium that never returns to useful service. Worse, plated lithium forms dendritic structures that grow with repeated abuse, eventually piercing separator membranes and creating internal short circuits.
Degradation accumulates invisibly. A battery charged at -5°C shows no immediate symptoms. Performance seems normal. Six months later, capacity has declined noticeably. A year later, the battery holds 70% of original capacity and nobody understands why. Forum discussions fill with theories about "bad batches" and "quality problems" when the actual cause sits in charging logs that nobody reviews.
A thermistor measuring cell temperature, a MOSFET interrupting charge current, and firmware logic connecting them prevents all cold-charging damage. Cost at manufacturing scale: almost nothing. Every battery sold for outdoor applications without this protection ships with a hidden self-destruct timer activated by winter use. Budget batteries omit this protection because buyers cannot verify its presence without destructive testing, and warranty claims can be denied by attributing damage to "user abuse" without proof of missing protection.
Heated battery variants incorporate resistive heating elements that warm cells to safe charging temperature before accepting current. Heating cycles consume energy from charge sources, not from batteries themselves, so the only penalty is extended charge time on cold mornings. Any cold-climate installation lacking heated batteries operates on borrowed time.
Voltage Behavior During Discharge
Discharge curves for LiFePO4 remain remarkably flat between 90% and 10% state of charge. Voltage holds above 12.8V through most of discharge cycles, then drops steeply toward 10V cutoff thresholds as batteries approach exhaustion.
A 12V water pump designed for 13V input maintains full flow rate throughout battery cycles rather than slowing progressively as voltage sags. LED drivers maintain consistent brightness. DC-DC converters achieve better efficiency with stable input voltage.
But when voltage barely changes across 80% of usable capacity, measuring voltage tells almost nothing about remaining energy.
Sophisticated BMS designs integrate charge and discharge current over time to track energy in and out. Budget batteries skip this entirely and estimate state of charge from voltage alone. Users observe capacity readings jumping by 20% between measurements seconds apart. "50% remaining" warnings precede immediate shutdown. Confidence in instrumentation collapses.
RV and Marine Systems
A typical RV electrical load of 1,200W-1,500W draws from a 100Ah battery bank through a 2,000W inverter. Inverters consume power: conversion losses of 10-15% mean that 1,500W to loads requires 1,650W-1,700W from batteries. At 12.8V nominal, this translates to 130A or more, exceeding true continuous ratings of most 100Ah batteries regardless of advertised specifications.
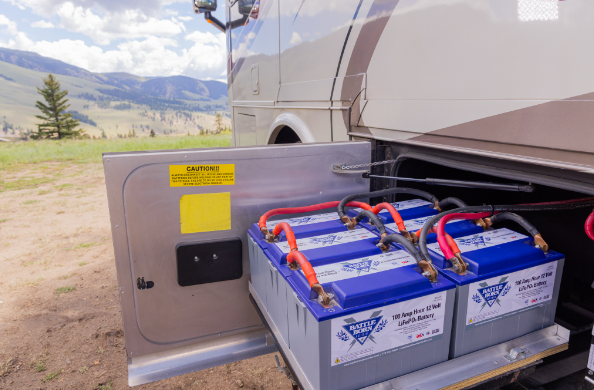
RV applications demand reliable battery performance

Marine environments present unique corrosion challenges
At 1,500W sustained draw accounting for inverter losses, a single 100Ah LiFePO4 battery provides roughly 45 minutes of runtime.
"100Ah" and "45 minutes of air conditioning" describe identical performance.
Buyers who imagine "100 amp hours" means "100 amps for one hour" discover their error through frustration. Marketing materials emphasize amp-hour ratings because larger numbers sell better, while carefully avoiding watt-hour calculations that reveal actual energy storage. A 100Ah 12V battery holds 1,280Wh. A 1,500W air conditioner plus inverter losses depletes this in under an hour.
Salt air corrodes every exposed metal surface on boats, beginning with terminals and progressing to mounting hardware, BMS components, and eventually internal cell connections. Corrosion proceeds invisibly behind plastic cases until resistance rises enough to cause heating, voltage drops, or complete connection failure. Vibration from engine operation and wave impact fatigues spot welds and crimped connections designed for stationary service. Humidity penetrates enclosures through pressure cycling as temperatures rise and fall, condensing on circuit boards and accelerating electrochemical corrosion of traces and solder joints.
Batteries marketed for marine service command premiums of 40-60% above visually identical terrestrial units. Premiums buy real engineering differences: potted electronics that exclude moisture, redundant terminal sealing with marine-grade compounds, conformal coating on circuit boards, and cell mounting designed for shock and vibration exposure. Whether any particular "marine rated" battery actually incorporates these features remains unverifiable without destructive inspection. Buyers installing standard batteries in marine applications to save money typically spend more on premature replacements than marine premiums would have cost, though survivor bias ensures that forum testimonials overrepresent lucky outcomes.
Solar Storage
Solar panels degrade less than 20% after 25 years in field studies. Charge controllers contain no wear components and fail from manufacturing defects or surge damage rather than aging. Wiring lasts indefinitely absent physical damage or corrosion.
Batteries require replacement every 5-15 years depending on depth of discharge patterns, temperature exposure, and charging quality.
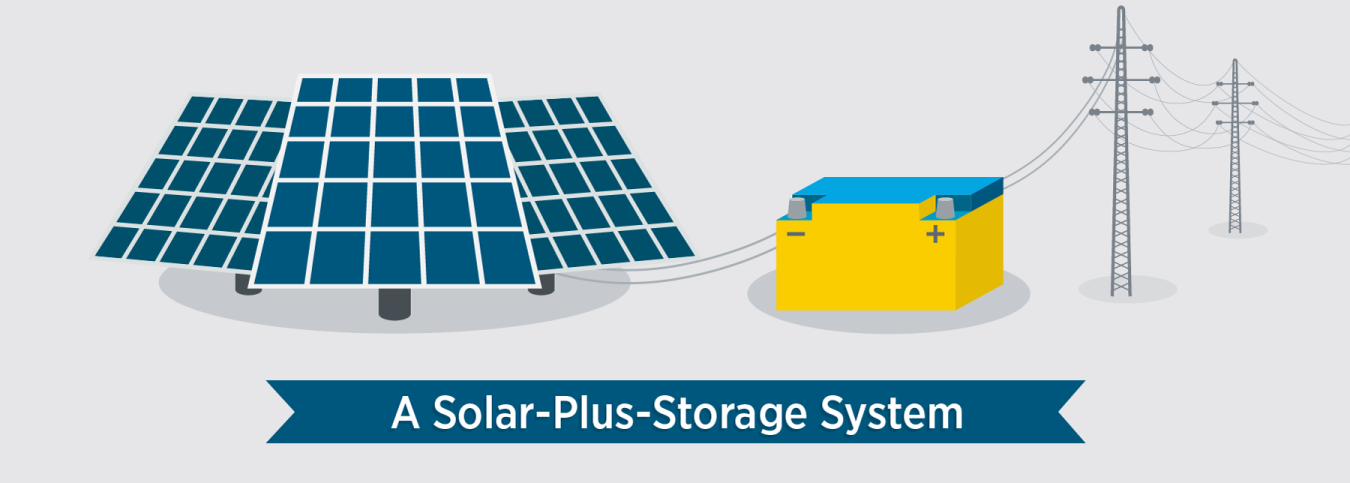
Solar storage systems depend on battery longevity for economic viability
"20-year payback" calculations that justify solar investments rarely account for two or three battery replacements across that period, each costing hundreds to thousands of dollars. Economics still favor solar in most analyses, but true costs exceed optimistic projections that motivate initial purchases.
Charge controller selection influences battery longevity more than battery selection influences battery longevity.
Maximum power point tracking (MPPT) controllers extract 15-30% more energy from solar panels than pulse-width modulation (PWM) alternatives, meaning faster charging and shorter time spent in partially-charged states that accelerate capacity loss. More importantly, MPPT controllers from reputable manufacturers implement proper lithium charging profiles: correct bulk voltage, appropriate absorption time limits, accurate temperature compensation, and suitable float voltage for long-term maintenance.
Budget controllers designed for lead-acid batteries and "compatible" with lithium through marketing assertion rather than engineering validation systematically damage lithium packs through extended absorption phases that overcharge cells, incorrect voltage setpoints that accelerate electrolyte decomposition, and absent temperature compensation that undercharges in winter and overcharges in summer.
A quality charge controller paired with budget batteries routinely outperforms a budget controller paired with premium cells.
At 25°C, a four-cell LiFePO4 pack charges optimally at 14.4-14.6V. At 40°C, this voltage forces excessive current into cells that should terminate charging earlier, stressing electrode structures and accelerating electrolyte decomposition. At 5°C, the same voltage terminates charging before cells reach full capacity, leaving 10-15% of energy unharvested each cycle and preventing balancing that occurs only during full charge.
Controllers lacking temperature compensation apply fixed voltage regardless of conditions. Damage accumulates invisibly until capacity loss becomes undeniable, at which point warranties have expired.
Backup Power
Essential load backing (refrigerator, lighting, internet equipment, medical devices) typically draws 300-500W average. A 100Ah battery powers this load for 2-4 hours. Four-battery banks extend this to 10-15 hours.
A single 400Ah battery bank provides less reliability than two independent 200Ah banks with automatic transfer switching.
Capacity is identical. Failure modes differ completely. In single-bank configurations, one BMS fault disables everything. One cell defect disables everything. One connection failure disables everything. Parallel-redundant configurations survive any single failure with 50% capacity remaining, providing hours of additional backup time while repairs proceed.
Reliable backup power requires thoughtful system architecture beyond raw capacity
Consumer-grade automatic transfer switches detect grid failure and switch to battery power within 10-20 milliseconds. For lighting and refrigerators, this interval passes unnoticed. For computers, medical equipment, and networked devices, 15 milliseconds without power triggers shutdowns, alarms, and data corruption. Equipment restarts on battery power moments later, but damage is done.
Online UPS topology eliminates transfer time entirely by running loads continuously from battery power while using grid power to maintain battery charge. Grids fail and nothing changes from load perspectives. Topology costs more than simple transfer switching. For critical loads, premiums buy genuine protection.
Heat and Aging
Batteries operated continuously at 35°C age twice as fast as identical units at 25°C. At 45°C, four times as fast. Chemical reaction rates governing degradation double with each 10°C temperature increase.
Desert solar installations routinely see battery compartment temperatures exceeding 50°C during summer months. Batteries in unventilated enclosures within vehicles parked in sun reach similar temperatures. Accelerated aging compounds with each hot season until capacity loss becomes evident, typically in 3-5 years rather than the 10-15 years that temperate-climate installations achieve.
A thermostatically-controlled ventilation fan maintaining compartment temperature below 35°C can double or triple service life in hot climates. Fans cost less than single premium battery cells.
Thermal management dramatically impacts battery longevity and performance
Doubling discharge current quadruples heat generation inside batteries. Units pulling 50A in 30°C compartments may stabilize at 40°C internal temperature. The same batteries at 100A reach 55°C or higher depending on enclosure thermal resistance.
Fully-charged batteries in hot garages lose capacity at triple the rate of identical batteries in climate-controlled storage. Seasonal equipment stored through summer heat ages substantially even sitting idle.
Cold Weather Effects
At 0°C, a 100Ah LiFePO4 battery delivers approximately 90Ah. At -10°C: roughly 85Ah. At -20°C: around 75Ah.
Internal resistance rises in cold conditions, reducing maximum discharge current more dramatically than capacity metrics suggest. Batteries sustaining 100A at room temperature may support only 60A at -10°C before voltage collapses below equipment cutoff thresholds. Cold-climate installations serving high-power loads require capacity sizing that accounts for both reduced energy storage and reduced power delivery.
Heated batteries are not optional in cold climates.
Humidity Effects
Terminal corrosion in humid environments increases connection resistance, creating hot spots during high-current discharge. Corrosion begins at terminal surfaces and progresses inward along crimped or bolted connections. Elevated resistance converts current flow to heat that further accelerates corrosion. Positive feedback loops proceed until connections fail entirely or generated heat ignites adjacent materials.
A single corroded connection in a series string limits entire bank current to a fraction of rated capacity while concentrating thermal stress at one point.
IP65 certification indicates dust exclusion and survival of low-pressure water jets but permits moisture intrusion over time. IP67 certification indicates temporary immersion tolerance but still permits vapor transmission through seals and pressure-driven moisture migration during temperature cycling.
Durable installations in humid environments supplement enclosure ratings with desiccant packets that absorb infiltrated moisture, conformal coating on circuit boards that prevents condensation damage, and dielectric grease on connections that excludes moisture from contact surfaces.
Connection resistance measurement identifies developing problems before they cause failures. Connections reading a few milliohms at installation that read 10-20 milliohms months later have begun degradation progressions that end in failure.
Sizing for Daily Consumption
Standard calculations begin with load inventories:
LED lighting (50W × 6 hours) = 300Wh
Laptop charging (65W × 3 hours) = 195Wh
Refrigerator (60W average × 24 hours) = 1,440Wh
Water pump (100W × 0.5 hours) = 50Wh
Total calculated consumption = 1,985Wh
Refrigerators draw 60W average but cycle between 0W and 150W+ as compressors run and rest; surge current at compressor start stresses inverters sized for average draw. "6 hours" of lighting assumes occupants who reliably extinguish lights on schedule; actual usage exceeds estimates. Laptop calculations ignore tablets, phone chargers, portable speakers, and other devices that accompany modern life. Water pump estimates assume brief use; actual consumption during showers, dish washing, and toilet flushing exceeds token half-hour allocations.
Honest sizing adds 25% margin for underestimation inherent in load inventories, then adds another 20-25% for efficiency losses in inverters, charge controllers, and wiring. Calculated 1,985Wh loads become 2,800-3,100Wh actual requirements. Systems sized using standard calculations consistently disappoint.
Phantom loads accumulate unnoticed.
Inverter standby consumption of 10-25W runs continuously whether loads are active or not, adding 240-600Wh daily that load inventories never include. Chargers left plugged in draw standby power. Control electronics consume power. Accumulation of parasitic draws often exceeds intentional consumption in energy-conscious installations.
Autonomy Days
Three days autonomy represents a common design target, intended to bridge extended cloudy weather. Adequate for temperate climates with reliable weather patterns. Inadequate for Pacific Northwest winters or tropical monsoon seasons where week-long stretches without useful solar production occur regularly.
Autonomy calculations must use worst-case solar production rather than annual averages. Locations averaging 4.5 peak sun hours annually may deliver only 1.5 hours during worst months. Systems sized for average production fail precisely when reliability matters most.
Three days autonomy at approximately 2,000Wh daily requires 6,000Wh storage. Five 100Ah batteries at 90% depth of discharge deliver 5,760Wh, leaving minimal margin. Six batteries provide adequate reserves. Extending autonomy to five days requires roughly 10,000Wh storage: eight batteries.
Pure battery autonomy beyond 4-5 days rarely makes economic sense. Generator backup for extended outages costs less than battery capacity required to avoid it.
100Ah vs 200Ah Configurations
Two 100Ah batteries in parallel versus one 200Ah battery: parallel configurations win for most applications despite increased wiring complexity.
One failed 100Ah battery leaves 50% capacity operational.
One failed 200Ah battery leaves zero.
Failure probability is identical for equal total cell count; failure consequences differ completely.
Two 25-pound batteries distribute load across structures and fit compartments that single 50-pound units cannot enter.
Two 100Ah batteries typically cost 15-25% less than one 200Ah battery at equivalent total capacity. Manufacturing economies favor popular cell formats.
Cables from each battery to common busbars must match in length to ensure balanced current sharing; length differences create resistance imbalances that overload batteries with shorter connections. Individual fusing on each positive terminal protects against internal short circuits propagating between paralleled batteries.
State of Charge Management
Operating between 20% and 80% state of charge extends cycle life substantially compared to full-depth cycling. Stress on electrode structures increases at both extremes: fully charged cells experience maximum voltage stress on cathode materials; fully discharged cells experience lithiation stress on anode structures.
Reaching only 80% charge requires deliberate intervention.
Charge termination based on time, voltage monitoring with early cutoff, or BMS programming adjustment can achieve targets. Most users implement none of these, instead charging to 100% because that is what charging equipment does by default.
BMS balancing circuits activate only during final absorption phases when cell voltages diverge slightly and BMS bleeds excess charge from higher cells. Batteries that never reach full charge never trigger balancing. Monthly full-charge cycles followed by immediate partial discharge to 80% capture balancing benefits while minimizing full-state stress duration.
Storage at 50-60% charge minimizes aging from both high-voltage stress and low-voltage stress during extended idle periods.
Charging Parameters
Rates of 0.2C to 0.5C (20A-50A for a 100Ah battery) represent acceptable ranges. Lower rates extend charge time but minimize thermal and electrochemical stress on electrode structures. Higher rates finish faster but generate heat that accelerates aging.
LiFePO4 chemistry requires bulk charging voltage of 14.4-14.6V for four-cell 12V packs, transitioning to float voltage of 13.6V after cells reach full charge. Low voltage leaves capacity unharvested; high voltage stresses cells unnecessarily.
Temperature compensation coefficient for LiFePO4 chemistry runs approximately -3mV per cell per degree Celsius deviation from 25°C. 12V packs at 40°C require bulk voltage reduced by roughly 180mV from 25°C specifications. Chargers and controllers lacking temperature compensation systematically overcharge during hot weather and undercharge during cold weather.
Monitoring and Maintenance
Cell voltage spread during cycling indicates balancing effectiveness and cell matching. Spread exceeding 50mV between highest and lowest cells during discharge suggests capacity imbalance requiring attention. Persistent divergence after full-charge balancing cycles indicates cell defects that may warrant warranty claims.

Comprehensive monitoring enables predictive maintenance and optimal performance
Temperature during charging reveals thermal management adequacy. Temperatures exceeding 40°C during normal charging indicate inadequate ventilation, excessive charge rates, or internal resistance elevation that precedes failure.
Physical inspection catches problems that electronic monitoring cannot detect.
Terminal corrosion increases resistance invisibly until current flow generates enough heat to cause damage. Loose mounting hardware from vibration creates intermittent connections. Case damage from impacts creates safety hazards invisible to BMS monitoring.
Quarterly inspection covering terminals, connection torque, ventilation paths, and case condition identifies developing problems while remediation costs little.
Preventable failures occur constantly.