How to Conduct Incoming Quality Inspection for Lithium Battery Shipments
Long-Form Analysis
The 2013 Boeing 787 Dreamliner battery fires grounded the entire fleet for three months. The NTSB traced the JAL Boston incident to an internal short in a GS Yuasa lithium cobalt oxide cell. In the Korean ESS fire cluster between 2017 and 2019, over 20 grid-scale battery systems burned, and the government investigation named cell-level defects as a contributing factor alongside BMS and installation issues. A123 Systems had a recall on Fisker Karma cells in 2012 for manufacturing alignment defects. In every case the defects existed in the cells at the time of manufacture and passed through the supply chain into finished products.
Incoming quality inspection is supposed to prevent this. Here is what it takes for it to work.
Supplier CoA Data and the Self-Discharge Problem
These two topics are linked in a way that most inspection protocols do not acknowledge, so they belong together.
The Certificate of Analysis from the supplier contains measured lot data for OCV, capacity, impedance, and whatever else the purchase specification calls out. The standard practice is to confirm the numbers are in spec and file the document. This practice extracts about 10% of the information the CoA contains. The other 90% is in the trends across lots. Plot the lot mean OCV, capacity, and impedance from the last ten CoAs for the same part number. A sudden tightening of the reported capacity bin width, beyond what the supplier's process capability established during qualification would produce, suggests re-grading: running cells through additional formation cycles to push them into the target bin. Re-graded cells have thicker SEI from the extra electrochemical cycling and they age faster. The CoA does not report re-grading. The implausible tightness of the reported capacity spread is the signal.
This connects to self-discharge screening because re-graded cells can mask micro-short signatures. A cell with a micro-short that went through two formation cycles has had more time and more electrochemical activity at the defect site. The micro-short may have partially healed through localized SEI formation over the particle, or it may have worsened through dendrite growth. Either way, the self-discharge K-value baseline for re-graded cells is different from first-pass cells, and if the screening threshold was established using first-pass cells from the qualification lots, applying it to re-graded cells without adjustment produces either false positives or, worse, missed detections.
Self-discharge screening is the only incoming test that finds metallic particle contamination. A particle of iron, copper, or nickel on the electrode surface, 10 to 50 micrometers, produces a micro-short with microamp-level leakage current. Charge the cells, rest them in a temperature-controlled environment, measure the stabilized voltage decay rate after reversible relaxation has subsided (48 to 72 hours into the rest). The stabilized dV/dt is the K-value. Cells carrying micro-shorts show elevated K-values.
The thermal environment determines whether this test produces data or garbage.
The OCV temperature coefficient creates voltage fluctuations from room temperature variation that sit on top of the self-discharge signal. A room swinging plus or minus 1 °C is useless. Plus or minus 0.3 °C minimum. Large automotive OEMs running sensitive programs hold to plus or minus 0.1 °C. The reason so many mid-tier battery pack assemblers have tried self-discharge screening, gotten noisy results, and abandoned it is not that the method fails. The room fails. And because setting up a properly controlled room costs real money and real floor space, the test gets dropped from the incoming protocol and replaced with nothing, leaving the most consequential defect category unscreened.
SoC during screening changes detection sensitivity because many micro-shorts are voltage-activated. Higher SoC means higher potential difference across the short means more leakage current means stronger signal. Testing at 40% SoC is less sensitive than testing at 80% SoC. Most operations test at shipping SoC because it avoids extra charging steps and reduces the safety overhead of storing large numbers of highly charged cells. The sensitivity tradeoff is accepted, often without being explicitly evaluated.
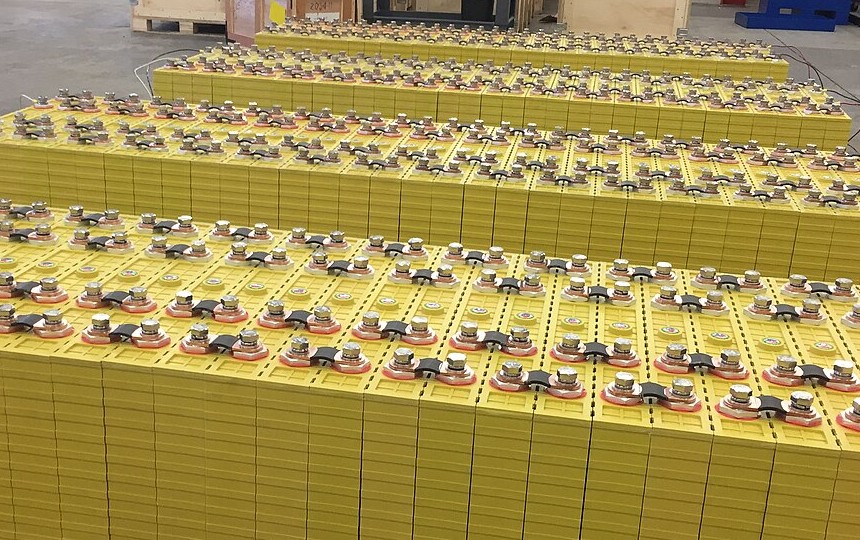
AQL sampling breaks down here because metallic contamination clusters in production sequence. A worn slitting blade sheds iron particles into consecutive cells. The affected cells are physically adjacent in the packaging. A random AQL sample drawn from scattered positions in the shipment has a real chance of missing the entire cluster. For safety-critical applications, 100% screening is the defensible position. The cost is charging, controlled storage for one to two weeks, and re-measurement. In a field-safety-event calculus, this is small.
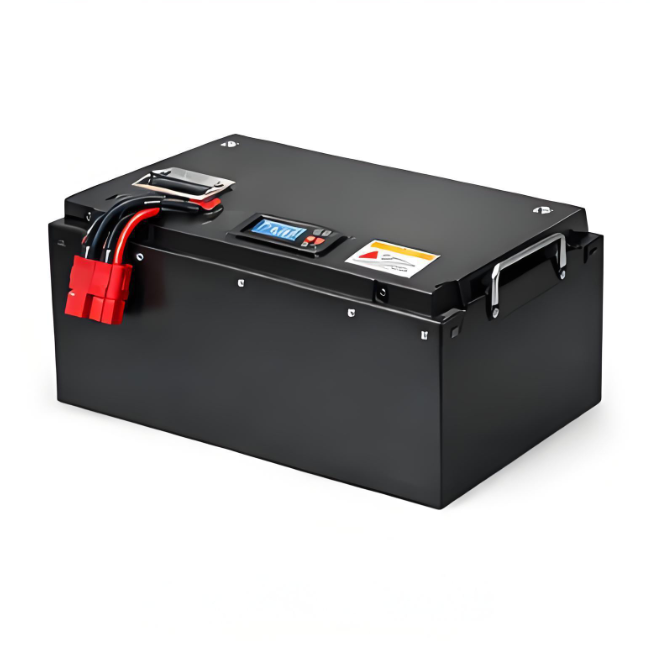
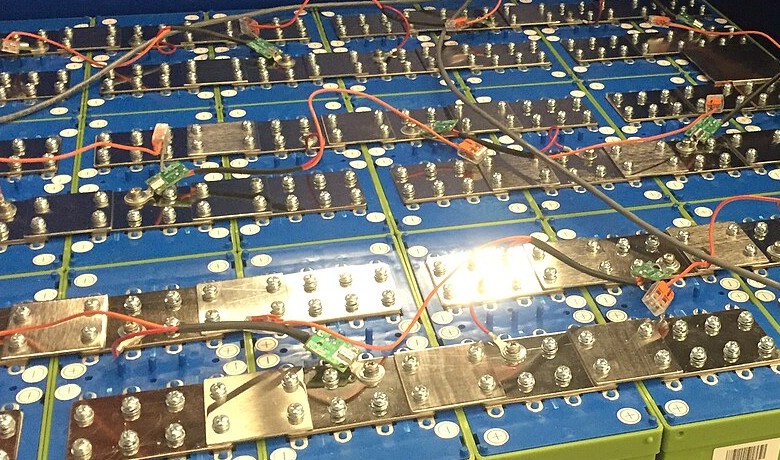
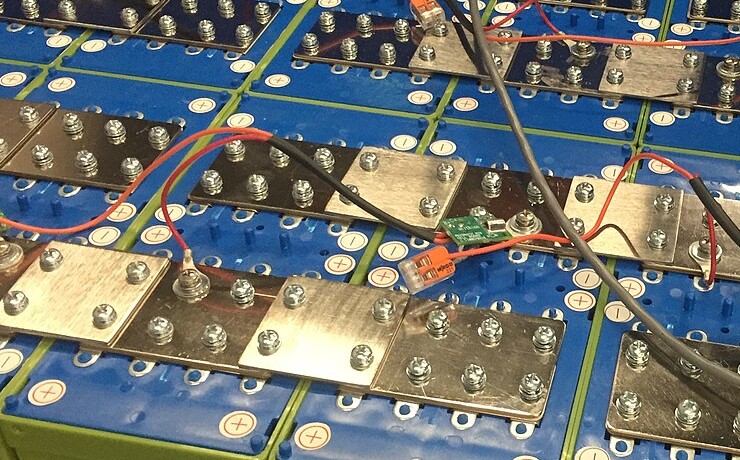
Production flow compatibility: provisional acceptance into bonded inventory, screening in parallel, quarantine if the screen fails. Lot traceability to the cell level is a prerequisite. Without traceability, a failed screen produces a report and nothing happens because nobody can find the cells from that lot that already went into pack assembly.
Temperature Logger
If the logger shows the shipment exceeded 60 °C, quarantine. Cells exposed to sustained high temperature read normal on every fast incoming test. OCV, impedance, DCIR, initial capacity all look fine. The damage is accelerated SEI growth consuming electrolyte that the cell needed for its full service life. The consequence appears as steeper capacity fade around cycle 200 to 300.
If the logger shows the shipment went below minus 20 °C, the concern is different: electrolyte component freezing (EC has a melting point around 36 °C, but it is depressed in the solvent blend; at minus 20 °C to minus 30 °C some crystallization can occur depending on formulation) and mechanical stress on seals and welds from thermal contraction. Cold-damaged cells may show elevated impedance at incoming if measured before full thermal recovery. Or they may show nothing. The risk profile differs from heat damage but the action is the same: quarantine and evaluate.
Pouch cells shipped standing on edge deserve attention here because the resulting electrode displacement damage is also invisible to electrical testing. Gravity plus vibration over days of transit shifts electrode layers relative to each other. Where the anode no longer overlaps the cathode, lithium plates on charging. Shows up 50 to 100 cycles later. The dock check is physical: verify orientation and compression in the inner packaging.
OCV
Construct the histogram. This takes five minutes on data already being collected. A bimodal distribution, two humps instead of one, means two formation sub-lots with different charge endpoints were mixed in the shipment. Pack-level consequence: SoC imbalance from cycle one, BMS forced into continuous balancing, uneven aging across cells in the pack.
For LFP cells, OCV measurement conditions matter more than for NMC because the voltage plateau is so flat. The 30 mV span between 20% and 80% SoC means that a 1 °C temperature difference between cells produces an OCV difference (through the OCV temperature coefficient) that competes with the SoC variation. Rest time after handling matters too: any mechanical disturbance to the electrode stack generates transient micro-currents that perturb OCV for minutes to hours. Two hours of rest and plus or minus 0.5 °C thermal equilibration across the sample is the minimum for interpretable LFP OCV data. Most receiving docks do not provide either condition, and the resulting noise gets absorbed by widening the OCV spec until the spec catches nothing.
Impedance and DCIR
AC impedance at 1 kHz captures ohmic resistance. Temperature-dependent: roughly 0.5% to 1.0% per degree Celsius. A 10 °C difference between cells measured on a cold dock versus the 25 °C lab where the spec was written produces a 5% to 10% error band that swallows genuine cell-to-cell variation. Cell surface temperature must be recorded with every reading.
The 1 kHz measurement does not see charge-transfer resistance. A degraded electrode surface, an abnormal SEI, a contaminated interface: invisible at 1 kHz. DCIR measured with a 10 to 30 second pulse captures charge-transfer kinetics in addition to ohmic resistance. The ratio of DCIR to 1 kHz impedance, tracked on a lot-by-lot basis, indicates electrode-electrolyte interface health. When this ratio rises above the historical baseline for a given cell design, something has changed at the interface. Storage at elevated temperature before shipment is one cause. Electrolyte additive depletion is another. Cathode surface chemistry drift from a changed precursor lot is a third. All three predict accelerated aging that will not show up in initial capacity testing.
There is a gap in common IQI practice here: most incoming protocols measure either AC impedance or DCIR, not both. Measuring only one gives half the picture. The ratio between them is more informative than either number alone, and computing it requires both measurements on the same cell at the same SoC and temperature.
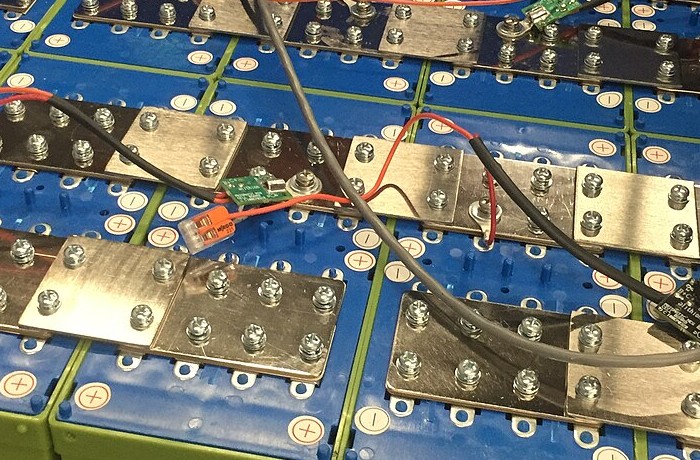
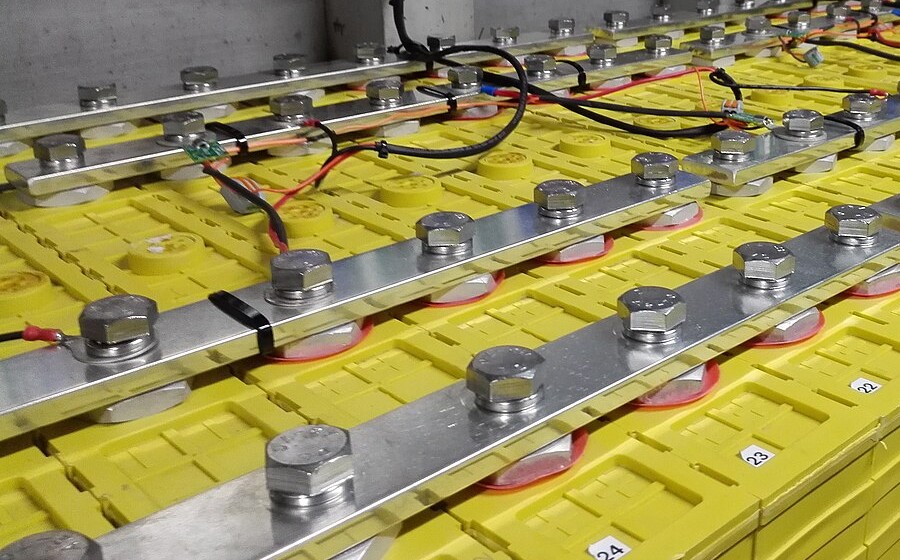
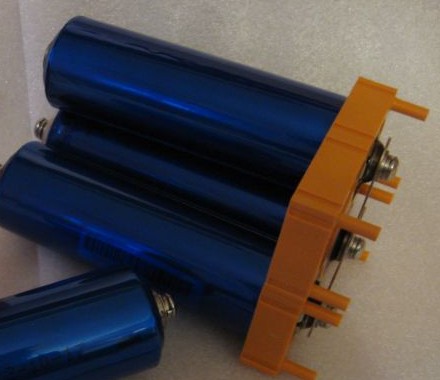
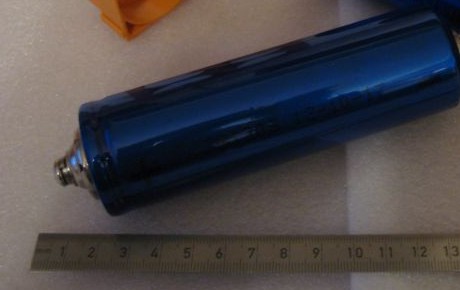
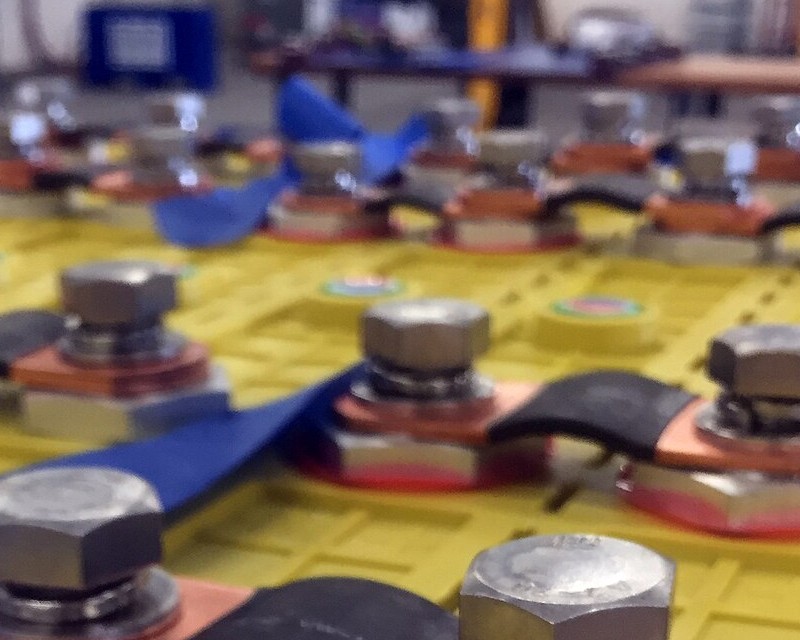
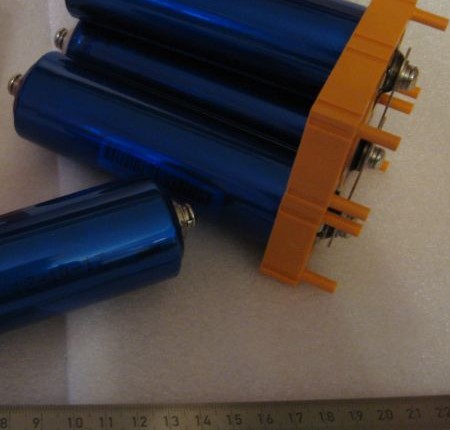
Dimensional, Mass, Seal, and Copper Dissolution
Pouch cell thickness variation: overthick means residual gas from incomplete degassing, or electrolyte overfill, or both. Cell mass: plot the histogram for the sample. Underweight cells are electrolyte-starved and will fade faster. An overweight outlier may have a double separator from a winding fault, which is a safety concern because the double separator creates a region of reduced ionic transport that can cause localized lithium plating.
Seal integrity on pouch cells at the tab exit zone. The seal transitions from polymer-to-polymer to polymer-to-metal-to-polymer at the tab, and this transition zone is the weak point. Examine under 20x magnification for micro-channeling, bubbles, delamination. On prismatic cells, crystalline deposits near laser weld seams are LiPF₆ decomposition products from a compromised hermetic seal. Laser weld defects are process-correlated within a production run, so finding one cell with this signature means pulling more cells from the same lot and likely the same production date range.
Copper dissolution from the anode current collector occurs when cell voltage drops below approximately 2.0 V. Copper ions migrate through the separator, deposit on the cathode, and can form dendrites during subsequent charging. This is permanent. Any cell arriving with OCV below the manufacturer's minimum voltage needs to be rejected regardless of other measurements. How it got there (deep discharge from packaging damage, parasitic current through conductive debris in the carton, prolonged storage without monitoring) matters for the shipping damage claim but not for the disposition decision. The copper is in the wrong place.
One observation that ties copper dissolution to the temperature logger discussion: cells shipped in containers with poor insulation in winter can experience low-temperature-induced capacity loss that looks like a deep discharge on the voltage reading at the dock. A cell at minus 25 °C may show an OCV reading that is artificially depressed by the low temperature rather than by actual SoC loss. Measuring voltage on cold cells and interpreting the reading as if the cell were at room temperature leads to false alarms about copper dissolution. The cell needs to warm up to at least 20 °C before the OCV reading means what you think it means. This is an area where the temperature logger data and the OCV data need to be interpreted together, not independently.
Data and Disposition
Lot-level impedance standard deviation on an S chart is the earliest indicator of supplier coating uniformity or electrolyte fill control degradation. The mean can stay stable while the scatter increases, and the widening scatter means the pack assembled from that lot will have higher cell-to-cell variation in internal resistance, producing uneven current distribution and uneven aging.
Correlation between incoming K-values and field warranty return rates by lot is the analysis that, once enough data exists, reveals whether the self-discharge threshold is set correctly or needs adjustment.
Hold dispositions need a named owner and a ten-business-day resolution deadline. The protocol needs revision when a quality escape happens, when the supplier changes material or process, and when the correlation data shows a parameter should be added or dropped.