






















Atrial Fibrillation Handheld Echocardiography Assessment Protocol
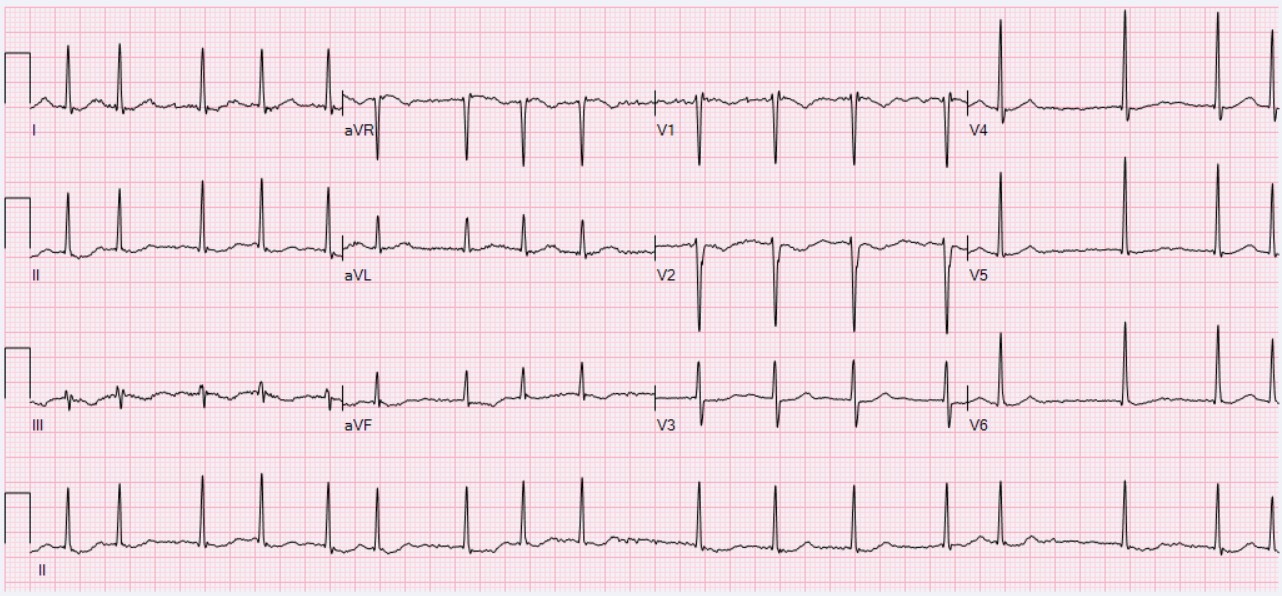
Atrial fibrillation is a disorganized heartbeat that begins in the upper chambers of the heart. A handheld scan reads what that rhythm does to the chambers and the muscle below it. The rhythm itself shows on the electrocardiogram, the trace of the heart’s electrical signal. A clinician turns to ultrasound to size the left atrium, judge the ventricle, and weigh the stroke risk the rhythm carries. A focused scan at the bedside builds the structural picture the treatment rests on.
What atrial fibrillation does to the heart
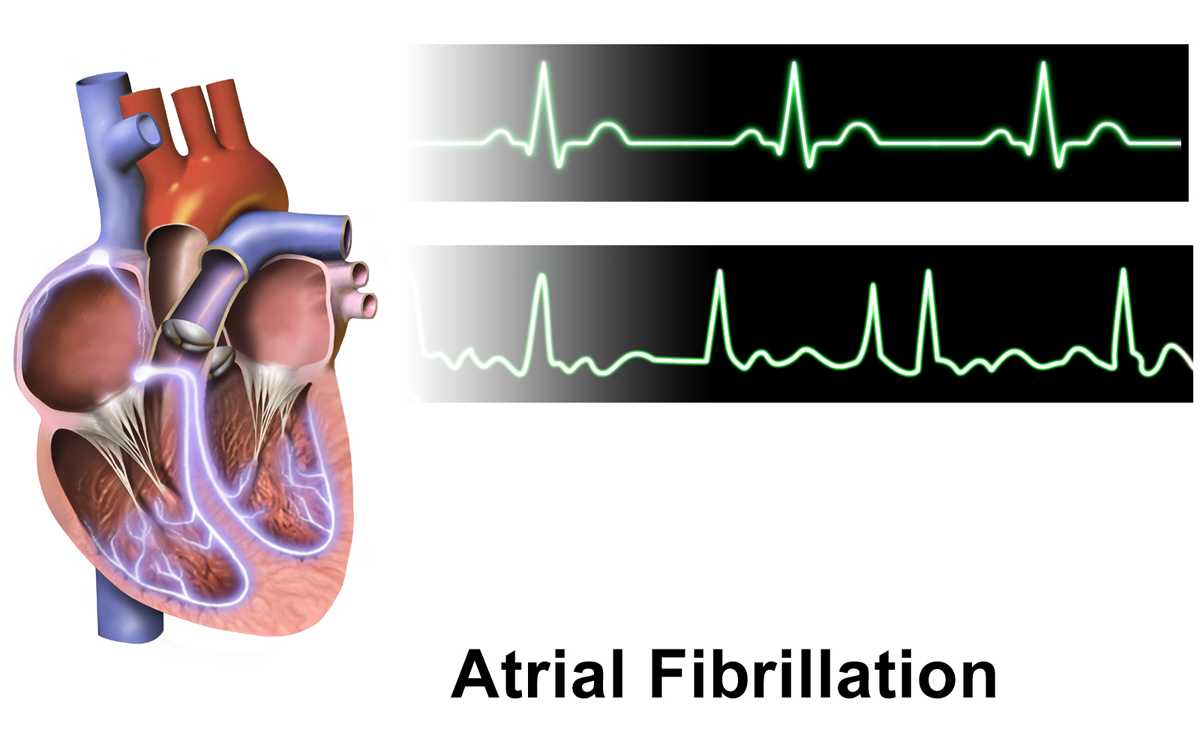
In atrial fibrillation the upper chambers lose their orderly beat. The signal that should sweep the atria in one clean wave breaks into a storm of disorganized impulses. The atrial walls quiver in place. The firm squeeze that normally tops up the ventricle below is gone. The lower chambers still beat, driven by whatever impulses cross to them. The pulse turns fast and loses its even spacing. A clinician meets this first as an irregular rhythm on the monitor and an irregular pulse at the wrist. The scan comes next, to read what the rhythm has done to the heart’s chambers. A clinician also reads how fast the ventricles are running, since a rate held under about a hundred and ten beats a minute at rest keeps the heart from tiring under the rhythm.
The lost atrial squeeze changes how the ventricle fills. A healthy atrium gives a final push at the end of filling, the kick that tops the ventricle off before it pumps. Atrial fibrillation takes that push away. The ventricle now fills on the passive flow alone. Its output then leans on the length of each gap between beats, since a longer gap lets more blood in before the next squeeze. The stroke volume swings from beat to beat across the uneven rhythm. A fast ventricular rate cuts the filling time on the quicker beats, so the heart moves less blood than the rate suggests. A clinician keeps this swing in mind on every measurement the scan returns. A clinician times the rate over a full minute in this rhythm, since counting a few seconds and multiplying misleads when no two gaps match.
The scan does not name the rhythm. The electrocardiogram already does that, reading the electrical signal the fibrillation scrambles. The ultrasound reads the structure the rhythm acts on and the marks it leaves over time. A clinician measures the left atrium, judges the strength of the left ventricle, checks each valve, and looks for the cause that set the rhythm going. Each of these feeds the decision on how to treat the rhythm and how hard to guard against a stroke. A clinician reads the scan alongside the rhythm strip, with each answering a question the other leaves open. The scan turns a rhythm on a monitor into a picture of the heart behind it. The scan also weighs the chance a clot has already formed, reading the size and the sluggishness of the atrium as a structural side to the stroke risk.
A handheld brings that picture to the bedside in a few minutes. A clinician scans the patient in the room where the rhythm was found, beside the monitor and the pulse. The focused study sizes the left atrium, eyes the ventricle’s squeeze, and sweeps the valves for a cause. A clinician folds the structural read into the same visit that caught the rhythm. The full laboratory study and the esophageal look at the appendage come later, when the case calls for them. A bedside scan moves the structural work-up forward to the hour the patient is first seen. A clinician keeps the handheld read focused, since a full chamber-by-chamber study and the esophageal look belong to the laboratory when the case grows complicated.
The atrial kick that goes missing
The missing atrial squeeze shows on the scan in the flow across the mitral valve. A clinician puts the sample on the inflow and reads the wave of blood that fills the ventricle. In atrial fibrillation that inflow comes as a single early wave, the passive filling with no late wave behind it. The atrial kick that would print a second wave is gone, since no organized contraction drives it. A clinician reads that single inflow wave as the signature of the lost kick. The pattern confirms on the scan what the rhythm strip shows on the electrical side. A clinician reads the height of that single wave for a rough sense of the pressure driving the filling, taken as an average over the run of beats.
The lost kick weighs heaviest where the ventricle is stiff. A thick or scarred ventricle relies on the atrial push to fill its last portion, so losing the kick drops its filling the hardest. A clinician reads a stiff ventricle in atrial fibrillation as a heart that has lost help it needed. The drop in filling can be enough to tip a borderline patient into breathlessness. A clinician ties the inflow pattern to the patient’s symptoms and the thickness of the wall. The single inflow wave then carries weight, standing for part of why the patient feels the rhythm. A clinician explains a patient’s new breathlessness in part by the lost kick, especially in an older heart whose walls have grown stiff over a lifetime. A clinician reads the inflow speed against the patient’s breathlessness, since a high early wave points to a stiff ventricle backing up into the lungs.
The left atrium that stretches
Atrial fibrillation and a stretched left atrium appear together. A rhythm that runs for months stretches the chamber wider. A chamber already widened by another disease gives the rhythm an easy place to settle. The size of the left atrium becomes one of the clearest numbers on the scan. A clinician measures it on the first study and follows it across the rest. The wider the atrium, the longer the rhythm has likely run. An atrium near its normal size still leaves room for a rhythm caught early. A clinician reads the atrium as the chamber that tells the longest story on the scan, holding the record of pressures that have come and gone.
A clinician sizes the left atrium in more than one way. One measure is its width on the long-axis view, the distance across the chamber behind the aorta. A width past about forty millimetres marks a chamber that has stretched. Another measure is the atrial volume, traced from two views and divided by the patient’s body size. The chamber-size standard from the American Society of Echocardiography calls a left atrial volume index above thirty-four millilitres for each square metre of body an enlarged atrium. A clinician reads the volume index as the steadier number, since it follows the chamber in every direction. A clinician traces the chamber in the four-chamber view and the two-chamber view, then lets the machine work the two outlines into a volume. A clinician keeps to the same view and the same trace each visit, since a number measured one way one time and another way the next hides the real change.
The left atrium works as a record of the heart’s recent history. Pressure that builds in a stiff or failing ventricle passes back into the atrium and stretches its walls over months. A stiff valve on the left side loads the atrium the same way. The chamber answers slowly. It widens under a load that stays on, so its size reads as the sum of the strain it has carried. A clinician reads a large left atrium as a chamber that has lived under pressure for a long time. The volume index sharpens that reading by removing body size from the number, so a small patient and a large one are judged on the same scale. The standard marks a mild enlargement above thirty-four millilitres for each square metre. Past forty-eight, the enlargement counts as severe. A clinician carries the volume index into the judgement of stroke risk and the choice of treatment, since a chamber stretched far points to a rhythm that has set in deep. The number also tempers hope for holding a normal rhythm, since a much-enlarged atrium tends to fall back into fibrillation after it is reset. A clinician records the atrial size on every study so the trend stands clear on the next visit. A raised filling pressure in the ventricle prints first on the atrium, which swells before the symptoms of heart failure arrive.
A handheld reads the left atrium on the same views it uses for the rest of the heart. A clinician opens the four-chamber view from the apex and the long-axis view from beside the sternum, with the atrium sitting in both. The eye catches a clearly enlarged atrium at a glance. The calipers then fix a number on it. A clinician traces the chamber at the moment it is largest, just before the mitral valve opens. An enlarged atrium on a first scan tells a clinician the rhythm is unlikely to be brand new. A clinician notes the size in the report so the next reader starts from the same mark.
The size of the atrium shapes the plan for the rhythm. A clinician weighs a large atrium against the hope of holding a normal beat once the rhythm is reset. A chamber stretched far has remodelled its walls, so it slips back into fibrillation more readily after a reset. A clinician reads a much-enlarged atrium as a sign that rate control may serve the patient better than repeated attempts to restore the rhythm. The number joins the patient’s symptoms and age in the choice. A clinician brings the atrial size to that decision as one of its firmest pieces of evidence. A clinician folds the atrial size into the stroke-risk score the team keeps, the tally of age, blood pressure, diabetes, heart failure, and any past stroke.
| Measure | Number | What it says |
|---|---|---|
| Left atrial volume index | above 34 mL/m² | enlarged atrium |
| Left atrial volume index | above 48 mL/m² | severely enlarged |
| Left atrial diameter | above 40 mm | enlarged atrium |
| Beats to average | about 10 | a fair reading in an irregular rhythm |
| Resting rate target | under about 110 /min | the heart kept from tiring |
| Onset before a reset | beyond 48 h | three weeks of anticoagulation or a TEE first |
Measuring in an irregular rhythm
The irregular rhythm makes every single beat an unreliable witness. A clinician never grades the heart on one beat in atrial fibrillation, since the beat after a long pause looks strong enough to overstate the whole heart. A clinician averages each measurement across several beats, often around ten, to land on a number that stands for the heart as a whole. The same rule holds for the ejection fraction, the inflow velocity, and any gradient the scan reads. A representative reading comes from the run of beats taken together.
The appendage and the clot
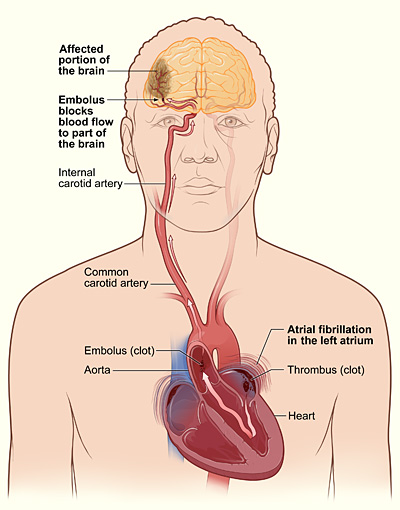
The danger in atrial fibrillation gathers in a small pouch off the left atrium, the left atrial appendage. Blood that should move briskly through the atrium slows and pools in this pouch once the squeeze is gone. Still blood clots. A clot in the appendage is the source of nearly every stroke atrial fibrillation causes. The clot can break loose, ride the bloodstream to the brain, and block an artery there. A clinician treats the appendage as the centre of the stroke risk, the reason anticoagulation sits at the heart of atrial fibrillation care. A clinician carries this picture into the talk with the patient about blood thinners, the single step that cuts the stroke risk the furthest. A clinician weighs that risk against the bleeding a blood thinner brings, a balance the whole plan turns on. A clinician keeps in mind that the rhythm raises the lifetime risk of a stroke several times over, which is why the appendage draws such care.
The appendage hides from a scan placed on the chest. It sits deep behind other structures, out of a handheld’s reach. A clinician cannot clear the appendage of clot from the chest wall. A clean transthoracic view never rules a clot out. The reliable look comes from a probe passed down the gullet, the transesophageal study, which sits a sensor right behind the atrium. That study shows the appendage, any clot inside it, and the sluggish swirl of blood that warns a clot may form. A clinician sends the patient for that deeper look when the appendage has to be cleared. A clinician can sometimes catch a swirl of slow blood or a hint of the appendage on an unusually clear chest study. The chest view stays too weak to trust for clearing a clot.
The appendage sets the rules for resetting the rhythm. A rhythm that has run beyond about two days may have let a clot form, so a clinician cannot shock it back to normal straight away. The safe path puts the patient on anticoagulation for around three weeks first, which lets any clot organize and clear. A transesophageal study offers a faster route, clearing the appendage on the spot so the reset can go ahead. Anticoagulation then carries on for at least four weeks after the rhythm is restored, since the stunned atrium stays prone to clot through its recovery. A clinician reads the appendage, the clock, and the anticoagulation together before any reset. On the esophageal study, a slow emptying flow from the appendage, under about twenty centimetres a second, marks a pouch where a clot forms easily. A clinician counts the rhythm’s age from the patient’s account, since a clear onset within the two-day window can open the door to an earlier reset.
What a focused scan adds in atrial fibrillation
The scan begins with the strength of the left ventricle. A clinician reads the ejection fraction, the share of blood the ventricle empties with each beat, averaged across several beats in the irregular rhythm. A weak ventricle shifts the whole plan, since a racing rhythm can itself drag the muscle down over weeks. A clinician who finds a weak ventricle looks for whether the rhythm caused the weakness, since a heart worn down by a racing rate can recover once the rate is controlled. The ejection fraction also steers the drugs, since several rhythm drugs are unsafe in a weak heart. A clinician carries the ventricle’s strength into nearly every choice that follows. A clinician reads a low ejection fraction as a reason to favour gentler drugs and a closer watch, since a weak heart tolerates a fast rhythm poorly. A clinician compares the ejection fraction against the patient’s old studies where they exist, since a fresh drop points more firmly to the rhythm as the culprit.
The scan then sweeps the valves to find the cause behind the rhythm. A tight mitral valve that old rheumatic fever has scarred drives the atrium into fibrillation and raises the clot risk higher than the usual case. A clinician who finds a rheumatic mitral valve reads the fibrillation as valvular, a label that locks in anticoagulation and rules out some of the newer drugs. A leaking valve or a thick ventricle points to another cause that has loaded the atrium. The scan turns up the structural reason the rhythm took hold, which the rhythm strip alone cannot give. A clinician names the cause from the scan so the treatment reaches past the rhythm to what drives it. A clinician reserves the label valvular for a mechanical valve or a moderate-to-tight mitral stenosis, the settings where the clot risk climbs the steepest.
The scan reads the rest of the heart for what sits alongside the rhythm. A thick-walled ventricle, the mark of long-standing high blood pressure, often sits behind atrial fibrillation and stiffens the filling further. A clinician checks the sac around the heart for fluid and the right side for the strain of a clot in the lungs, since a pulmonary embolism can throw the heart into fibrillation. The right ventricle and the pressure in the lungs round out the read where heart failure rides with the rhythm. A clinician gathers these findings into one structural account of the heart in fibrillation. A clinician reads the right ventricle’s size and the pressure in the lungs from the tricuspid jet, since a strained right heart can both cause and follow the rhythm. A clinician scans the lung bases in the same sitting, since fluid there confirms the heart failure the rhythm often rides with.
A focused scan ends in a short structural summary the rhythm decision rests on. A clinician sets down the size of the left atrium, the strength of the ventricle, the state of the valves, and any clue to the cause. These four lines tell the team how deep the rhythm has set in and how hard to guard against a stroke. A clinician adds the average rate the scan met and the patient’s symptoms to round out the picture. The summary hands the team a structural footing for the choice between slowing the rate and restoring the rhythm. A clinician builds that footing at the bedside in the time it takes to sweep the standard views. A clinician dates the summary and saves the clips, so the next study compares against a clear starting point.
Reading the same heart over time
Atrial fibrillation is a long road, so the scan repeats across it. A clinician follows the size of the left atrium and the strength of the ventricle from one visit to the next. The same views and the same beat-averaging keep the numbers honest across studies. A growing atrium warns that the rhythm is digging in deeper. An ejection fraction that slips over the visits warns that the rate is wearing the muscle down. A clinician reads the run of studies for the direction the heart is heading. A clinician sets the pace of the repeat scans by the heart itself, scanning again the sooner the numbers move.
A scan after the rhythm is reset checks whether the heart recovers. A clinician who slowed a racing rate looks back weeks later to see the ventricle regain its strength, the sign that the rhythm had been the cause. The atrium may shrink a little once the load eases. A long-stretched chamber still holds much of its size. A clinician times these repeat scans to the treatment, reading the heart against where it stood before. The recovery, or its absence, tells the clinician whether the chosen path is working. A clinician looks for the atrium to soften and the ventricle to lift in the weeks after the rate comes down, the pattern that marks a heart the rhythm had been tiring.
Atrial fibrillation stays a diagnosis made on the electrocardiogram. The scan reads the heart around that diagnosis. A handheld sizes the atrium, judges the ventricle, names a cause, and weighs the stroke risk, all at the bedside in minutes. The one thing it leaves to the deeper study is the appendage, the hidden pouch that holds the clot. A clinician reads the heart where the patient sits and sends on the case that needs the esophageal look. A structural read taken early starts the patient on the right path through a long disease. A clinician hands the patient a plain account of what the heart looks like, the size of the atrium and the strength of the pump, in words the patient can carry to the next visit.
Common questions about atrial fibrillation on a handheld scan
How does atrial fibrillation show on an ultrasound scan?
The scan reads what the rhythm does to the heart, since the rhythm itself lives on the electrocardiogram. It shows an enlarged left atrium, an inflow with its late atrial wave missing, and a ventricle whose output swings from beat to beat. A clinician reads these structural marks to gauge how long the rhythm has run and what it has cost the heart.
Can a handheld scan see a clot in the heart?
Not reliably. The clot in atrial fibrillation forms in the left atrial appendage, a small pouch tucked deep behind other structures, out of a chest scan’s reach. A clean view from the chest wall never rules a clot out. The reliable look comes from a transesophageal study, a probe passed down the gullet that sits a sensor right behind the atrium. A clinician sends the patient for that study when the appendage has to be cleared before resetting the rhythm.
Why does the left atrium matter in atrial fibrillation?
The left atrium records the strain the heart has carried. A rhythm that runs for months stretches the chamber. A stiff ventricle and a tight valve on the left side stretch it the same way. A clinician measures the atrial volume index, calling it enlarged above thirty-four millilitres for each square metre of body. A large atrium points to a long-standing rhythm and lowers the odds of holding a normal beat after a reset, so its size shapes the choice between rate control and rhythm control.
Does the scan diagnose atrial fibrillation?
No. The diagnosis is made on the electrocardiogram, which reads the disorganized electrical signal directly. The scan reads the heart’s structure and the marks the rhythm has left, the work-up that surrounds a known or suspected rhythm. A clinician reads the scan alongside the rhythm strip, with each answering what the other cannot.
Why average several beats in atrial fibrillation?
The rhythm is irregular, so the heart’s output changes from beat to beat. The beat after a long pause fills well and looks strong, enough to overstate the heart on its own. A clinician averages each measurement, often across about ten beats, to land on a number that stands for the whole heart. The ejection fraction, the inflow velocity, and any gradient all follow the same rule.

About the Author
Julien Mercier
Senior R&D Engineer · Medical Ultrasound Transducer Development
Senior R&D Engineer with an M.S. in Applied Physics and over 15 years of experience in medical ultrasound transducer development, specializing in the design verification and performance testing of high-frequency imaging transducers. Currently leading the development and verification of the company’s next-generation high-frequency linear-array transducer, responsible for imaging performance evaluation and reliability analysis in preclinical testing. Brings extensive hands-on experience in piezoelectric element tuning, beamforming parameter optimization, and system-level performance testing.