What Is a Battery Management System and How Does It Work
Energy & Infrastructure
What Is a Battery Management System and How Does It Work
Long-Form Analysis
A BMS measures cell voltages, pack current, and temperatures in a lithium-ion battery pack. It estimates state of charge and state of health. It balances cells. It enforces limits. It communicates with the host system.
The interesting question isn't what those functions are. The interesting question is why a $9 Alibaba BMS board and a $400 Continental automotive BMS ECU both claim to do all of those things and produce wildly different results in the field. The answer sits almost entirely in the analog voltage measurement and the state estimation algorithm. The rest of it, balancing hardware, protection logic, CAN bus, Modbus, contactors, that's all well-trodden engineering with known solutions and mature component ecosystems. Nobody's BMS fails because the CAN driver had a bug. Plenty of BMS products fail, slowly and invisibly, because the voltage readings have 6mV of systematic error that nobody caught during validation and that corrupts everything downstream.
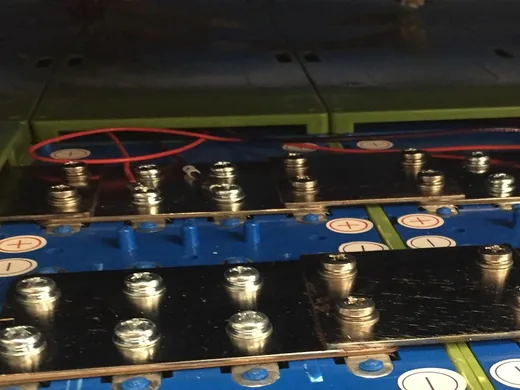
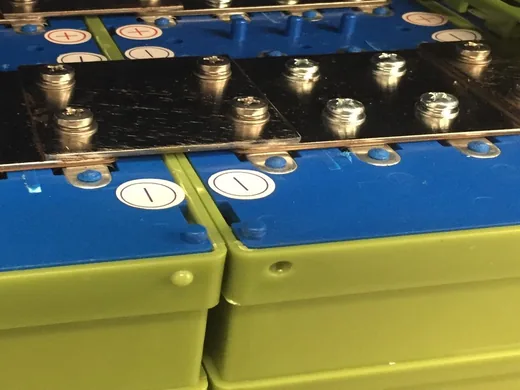
Cells
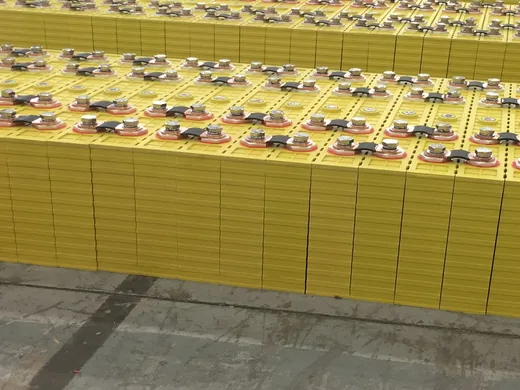
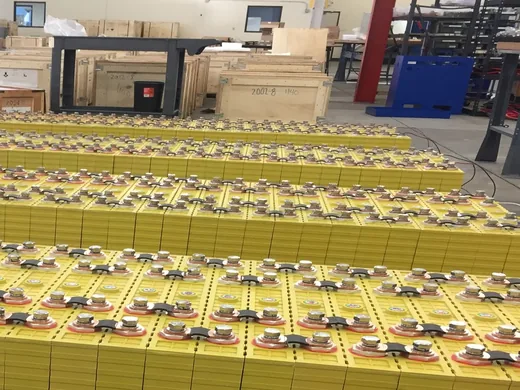
Cells from the same production lot aren't identical. Capacity spread of ±1.5% and resistance spread of ±8% on incoming inspection for good 21700 NMC cells from a tier-one manufacturer. Electrode coating thickness varies across the slot die width. Electrolyte fill volumes differ. Formation cycling temperature isn't uniform across the rack.
In series, every cell carries identical current. Smallest cell fills first, empties first. Pack energy equals that cell's energy. Over time, the weakest cell gets cycled proportionally harder, ages faster, falls further behind. A 3% spread at beginning of life can become 10% by mid-life if balancing is poor or if the thermal environment creates persistent temperature gradients across the pack.
Analog Measurement
The AFE is rated ±1.5mV on the eval board.
On a production board, 3 to 5mV is a good result. 8mV is common. And 8mV is a disaster, even though it sounds small, because the gap between NMC full charge (4.20V) and lithium plating (around 4.25V) is only 50mV and the measurement error eats directly into that margin. The BMS designer compensates by pulling charge termination down, maybe to 4.15V, sacrificing cell energy every cycle forever. Nobody notices. The pack works. It just delivers less than it should.
The ADBMS1818 from Analog Devices. ±1.5mV total measurement error on the bench. Excellent part. Completely irrelevant specification in practice, because the total measurement error on a production board is dominated by things that happen between the cell terminal and the IC input pin, and the IC datasheet says nothing about those things.
What things exactly.
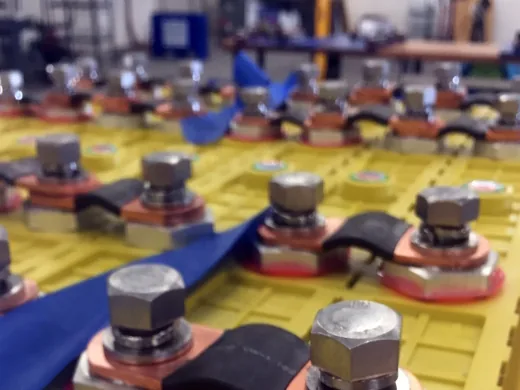
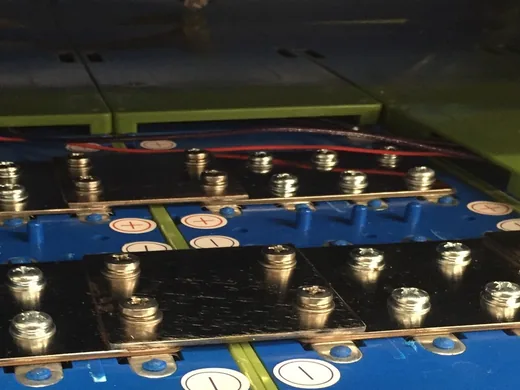
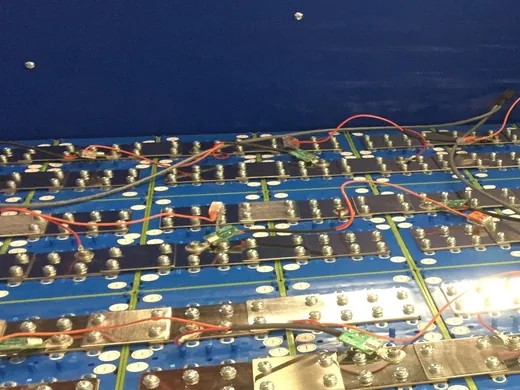
Sense wire coupling. A sense wire running alongside a busbar carrying inverter-switched current picks up noise through capacitive and inductive coupling. The magnitude depends on separation distance and loop area. Fifteen centimeters of parallel run at 5mm separation from a busbar carrying 10kHz PWM current can easily inject a millivolt or two.
Ground contamination. The AFE's voltage reference is only as clean as its ground. If the ground pour that the AFE reference connects to also carries return current from the CAN transceiver or the microcontroller or the balancing MOSFETs, those currents create voltage gradients across the pour that shift the reference. The shift is load-dependent and data-traffic-dependent. More CAN messages, more ground current, more reference offset, worse voltage readings. This particular failure mode is sneaky because it correlates with vehicle activity. The BMS reads cells less accurately exactly when the vehicle is doing something interesting, which is exactly when accurate readings matter most.
Thermoelectric EMFs. Solder joints between dissimilar metals generate Seebeck voltages. A copper-to-nickel junction (common at connector pins) generates about 15µV per degree C of temperature difference across the junction. Sounds negligible. A BMS board with ten such junctions in the sense path and a 15°C thermal gradient from a nearby power stage can accumulate 150µV of thermoelectric offset on one channel. Channels at different positions on the board see different gradients and accumulate different offsets. The effect drifts with the board's thermal profile, which changes with ambient temperature and load history, and the drift rate is slow enough that it looks like a cell voltage change rather than a measurement artifact. Distinguishing a 200µV thermoelectric drift from a 200µV cell voltage change caused by a slow internal short is essentially impossible from the BMS data alone.
The prototype board story. At a European tier-one supplier, first build of a gen-2 BMS platform, 8.2mV total error measured during validation. The number circulated widely enough in the automotive BMS community that it became a standard cautionary reference. The root causes were all of the above plus common-mode transient coupling through the isoSPI isolation barrier during inverter switching events. The fix took three board revisions over six months. Guard traces around high-impedance AFE inputs. Sense traces moved to a buried inner layer of the PCB stackup. Star-point grounding at the measurement connector replacing the shared ground pour. Harness breakout stubs shortened. A copper shield partition added between power and sense sections of the main pack connector. Rev four achieved 2.2mV.
Here is the thing about that fix: everything they did was analog layout. Nothing in the schematic changed after rev one. The schematic was correct from the beginning. The component selection was correct. The firmware was correct. Three board revisions and six months of engineering time were spent entirely on trace routing, ground topology, and mechanical cable management. This is not a software-fixable problem. A moving average doesn't help because the errors aren't random, they're systematic. They sit at DC or drift slowly, right in the measurement bandwidth, and pass through any linear digital filter unchanged. The persistent belief in parts of the embedded systems community that firmware-side signal processing can compensate for a noisy analog front end is, in the specific context of BMS voltage measurement, wrong.
The organizational implication is uncomfortable. The quality of a BMS product depends heavily on whether the team includes somebody with deep analog layout experience who has authority over the PCB design. Companies where the firmware team drives the architecture and the layout gets contracted out tend to ship boards in the 5 to 8mV range and struggle to improve. The limiting factor is almost never the AFE IC.
Simultaneous sampling. The ADBMS1818 captures all 18 channels at the same instant using sample-and-hold circuits, then the ADC converts them one at a time. Some cheaper AFEs skip the sample-and-hold. On the bench, identical results. In a system with an inverter, a load transient during a sequential scan creates a voltage step between channels measured before and after the transient. The BMS interprets this as cell imbalance. The balancing algorithm responds to the phantom imbalance. If passive, it wastes some energy chasing nothing. If active, it might shuttle charge the wrong direction, making the real spread worse.
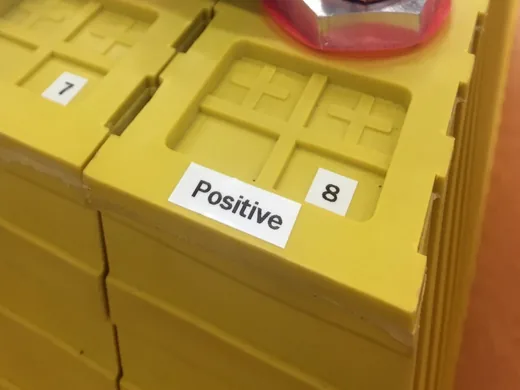
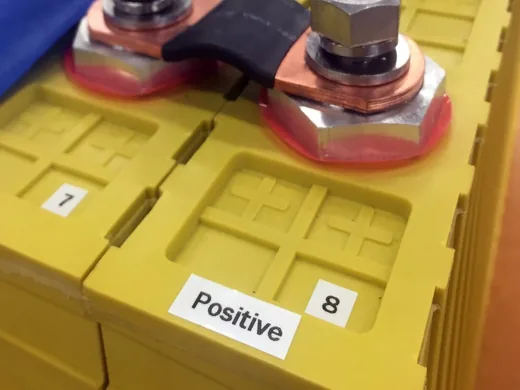
This compounds. Over months of operation, a steady trickle of balancing decisions driven by measurement timing artifacts slowly widens the actual cell-to-cell capacity distribution. When the field team eventually investigates the premature capacity divergence, they find cells that have drifted apart and blame the cell supplier. The BMS data log is useless for root-cause analysis because the transient artifact looks exactly like real data by the time it's sampled and stored. There's no flag, no metadata, nothing to distinguish a genuine 5mV cell-to-cell difference from a 5mV step caused by an inverter transient that happened to land between channel 7 and channel 8's conversion windows. Diagnosing this requires reproducing the conditions on a bench with independent reference instrumentation, and most field teams don't have the equipment or the hypothesis to run that test.
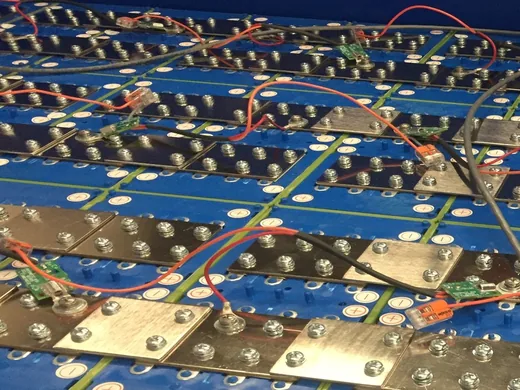
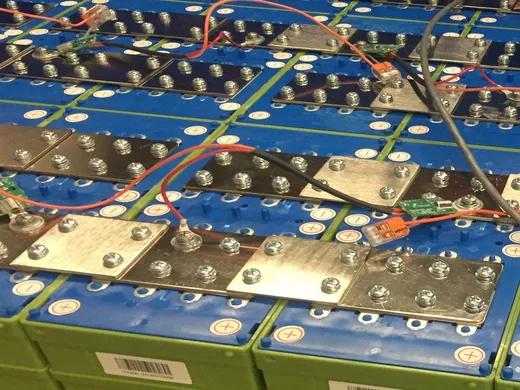
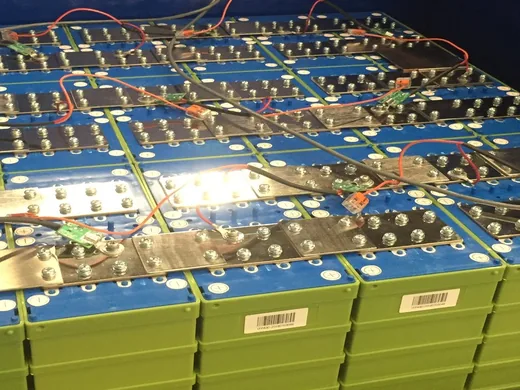
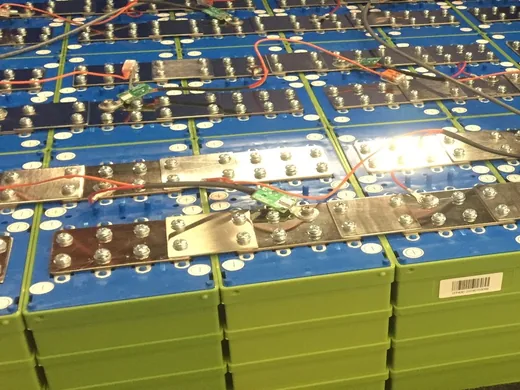
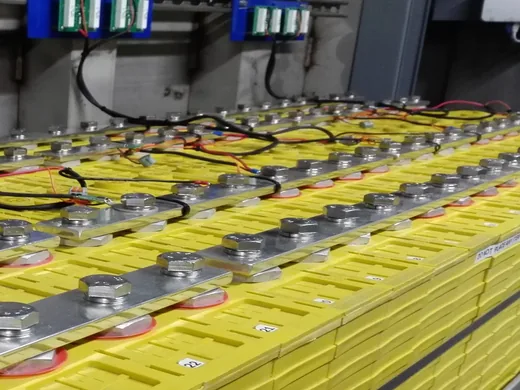
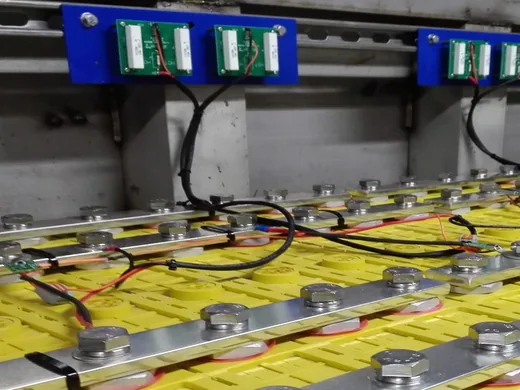
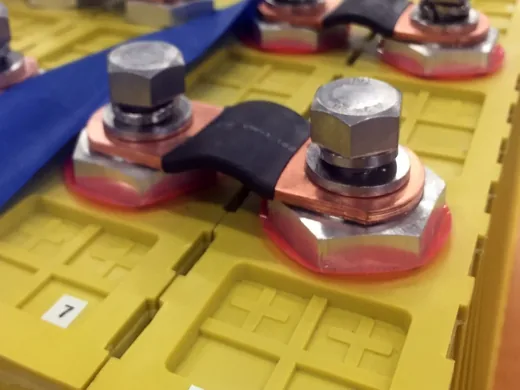
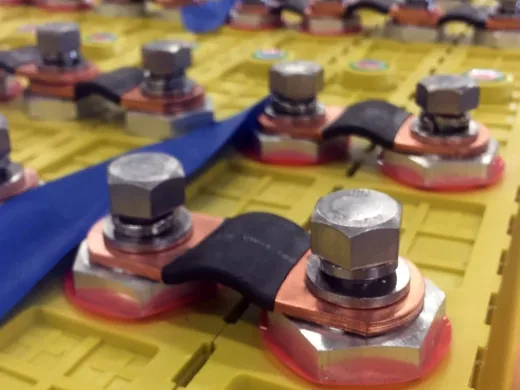
96 cells. Six ADBMS1818 devices daisy-chained over isoSPI. Each device handles its local group. Analog measurements stay within centimeters of the cell terminals. Digital data crosses the isolation barriers between devices.
Current
Shunt. Shunt monitor IC. Follow the app note. Low-current accuracy matters for coulomb counting. Hall sensors drift. Coulomb counting drifts because integration accumulates offset. Grid batteries at partial SOC for weeks without a full charge need model-based correction. Not much more to say. Current measurement is necessary and not particularly difficult to do adequately.
Temperature
SEI growth on graphite anodes accelerates with temperature. Arrhenius-type rate dependence, well documented by Dahn's group at Dalhousie, NREL's aging program, others. Roughly 2x rate per 10°C increase in average cell temperature. Chemistry-dependent (LFP is more thermally stable than NMC in this regard) but directionally consistent.
What matters for BMS design is not the Arrhenius relationship itself. What matters is the gap between what thermistors on the cell surface report and what the electrode interfaces inside the cell actually experience. The separator is a terrible thermal conductor. During fast charge, core temperature exceeds surface temperature by 10°C or more on large prismatic cells. Rhodri Owen at Warwick WMG measured this directly with embedded thermocouples. Ouyang's lab at Tsinghua published comparable data on LFP cells.
A BMS protecting at 45°C surface while the core sits at 55°C is allowing aging at roughly four times the rate the protection spec was designed for. This doesn't show up for years. Then it shows up as premature capacity fade. The postmortem blames cell quality. Or the cooling system. Or customer abuse. The missing thermal observer model in the BMS firmware is almost never identified as a contributing factor because most of the people running the investigation didn't know the observer was supposed to be there.
Implementing the observer is computationally cheap. Getting the parameters (through-plane thermal conductivity, thermal mass, interface resistance to cooling plate) requires months of characterization with equipment most BMS vendors don't own. Automotive OEMs invest in this. The broader market doesn't.
Derating. The BMS reduces current as temperature rises. Where the taper starts depends on warranty commitment. Products warranted five years or more should start tapering by 32 to 35°C. Consumer products often allow full current up to 42°C or higher because the warranty is two years and the damage doesn't become visible until year four. Late derating on long-warranty products is a mistake, full stop.
State Estimation
Plett. Gregory Plett. Battery Management Systems, Artech House, 2015, two volumes. The SOC estimation framework used by essentially every automotive BMS platform traces to this work. Volume I covers modeling. Volume II covers estimation.
Equivalent circuit model: series resistance, one or two RC pairs for polarization dynamics, SOC-dependent OCV lookup table as the voltage source. Each timestep, push measured current through the model, compute predicted terminal voltage, compare to the actual measurement, feed the error into an Extended Kalman Filter that corrects the SOC estimate. When the model matches the real cell, corrections are small and SOC tracks accurately. ±2% is achievable on a fresh NMC cell at 25°C with a properly parameterized model.
Then the cell ages. Resistance goes up as SEI thickens. RC time constants change as porosity evolves and electrolyte conductivity drops. The OCV curve changes shape as lithium is consumed and electrode stoichiometric windows shift. The model that was correct at beginning of life becomes progressively wrong.
Plett's dual-EKF runs two coupled filters. One estimates SOC. The other estimates model parameters (R, time constants, capacity), treating them as slowly varying hidden states. SOC filter depends on the parameter estimates. Parameter filter depends on the SOC estimate. Coupled system with stability constraints. Process noise tuning on the parameter filter is the critical knob. Too aggressive, parameters chase measurement noise and the whole thing oscillates. Too conservative, parameters can't keep up with real aging and SOC accuracy degrades over months.
Getting the tuning stable across the full operating envelope takes years of cell aging campaigns. Not algorithm development time. Data generation time. Hundreds of cells aged under controlled conditions at multiple temperatures and SOC levels, pulled out at intervals for re-parameterization. The algorithm has been published for more than a decade. The calibration data that makes it work in production costs millions of dollars and never gets published. Samsung SDI, LG, CATL, BYD, Continental, Bosch have built these datasets. Their tuning parameters and lookup tables are closely held IP.
Academic papers typically demonstrate the EKF on one cell chemistry at two or three temperatures and call the approach validated. That's a proof of concept. It has approximately nothing to do with the production problem, which is making the estimator work at month 30 on an aged cell from a supplier that wasn't the one used during development, at -10°C, after sitting at 50% SOC for two weeks.
LFP. The OCV curve between 20% and 80% SOC is nearly flat, less than 80mV across 60% of the capacity range. The EKF relies on OCV slope for observability (the mathematical property that lets voltage measurements correct the SOC estimate). When slope approaches zero, the filter can't tell the difference between a 5% SOC error and measurement noise. It reverts to coulomb counting with all the associated drift. SOC estimation on NMC is a solved problem for anyone willing to invest in calibration data. SOC estimation on LFP at mid-SOC, cold, on an aged cell, is not solved in production. Published claims of ±2% accuracy on LFP across the full SOC range deserve careful scrutiny of the test conditions before being taken seriously.
dQ/dV
Plotting the derivative of charge versus voltage produces a curve whose peaks correspond to electrode phase transitions. Each peak is a specific electrochemical event at a specific potential. As the cell ages, those peaks shift, broaden, split, or vanish, and the pattern of changes fingerprints specific degradation mechanisms.
In NMC, a peak near 3.4V shifting to lower voltage means lithium inventory depletion from SEI growth. A peak near 3.7V broadening means cathode active material damage, particle cracking, transition metal dissolution. Knowing which mechanism dominates matters for life prediction because the mechanisms have different trajectories. SEI-driven loss follows approximately square-root-of-time kinetics and decelerates as the layer thickens. Cathode cracking tends to accelerate as cracks propagate and expose more surface to electrolyte attack.
Same 5% capacity loss at the same calendar age, very different prognosis depending on whether the cause is SEI or cathode damage. No other diagnostic technique provides this mechanistic specificity.
Practical difficulty: dQ/dV peaks are well-resolved only at low C-rates (C/20 ideally). Field charging at C/2 to 2C smears the peaks with kinetic overpotential. Extracting usable dQ/dV signatures from real-world data where current rate and temperature vary continuously is a signal processing problem. Some automotive groups (conference presentations associated with BMW and VW battery development have shown progress) are working on it. The technique has not reached production firmware yet, as far as public information reveals. The broader industrial BMS market is not pursuing it at all.
Balancing
Voltage-based balancing under load is unreliable. Terminal voltage during discharge includes each cell's individual IR drop. Cells at the same voltage can be at different SOC if their resistances differ. Balancing to equal voltage under load can push the SOC spread wider.
SOC-based balancing is correct. Per-cell SOC estimation requires per-cell model parameterization. Automotive platforms implement this. Commodity BMS boards cannot, because the per-cell estimation infrastructure doesn't exist in their firmware and couldn't be calibrated even if it did.
Active balancing (inductor or transformer charge shuttle, five to ten dollars per channel) makes sense past three thousand expected cycles. Below that, passive (bleed resistors, under a dollar per channel) is adequate. Grid storage applications spec active. Consumer products spec passive. Both choices are rational given the respective economics.
Protection
Hard limits trigger disconnect: 4.25V upper, 2.5V lower for NMC, cell manufacturer's pulse current rating, 55 to 60°C. Soft limits derate current as conditions approach boundaries.
ISO 26262 ASIL C or D for automotive battery protection. Redundant voltage measurement paths, open-wire detection, plausibility checks (flagging readings that violate electrochemical possibility), hardware watchdog on independent clock domain forcing contactor opening if the main processor locks up. ASIL D single-point fault diagnostic coverage above 99%. This roughly doubles the AFE-related hardware cost, which is a significant fraction of total automotive BMS cost.
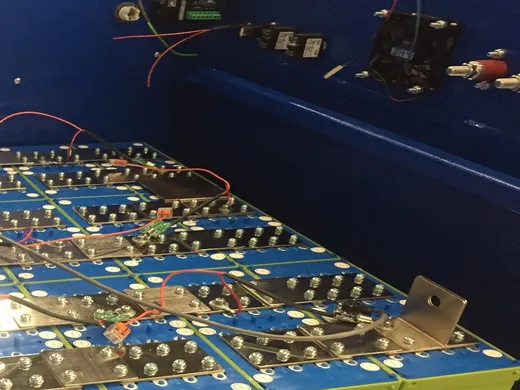
Architecture
Centralized for small packs up to about 16s. Distributed (daisy-chained AFEs, digital communication to master) for automotive and large industrial. Wireless BMS is emerging, BMW has adopted it, weight savings are real, connector elimination removes a field failure mode. Long-term RF reliability data inside metal battery enclosures doesn't exist yet.
Communication and Logging
CAN bus for automotive. Modbus for stationary storage. SunSpec Alliance register maps for cross-vendor interoperability.
Data logging at 1 to 10 second intervals captures per-cell voltages, temperatures, current, balancing activity, fault codes. This log serves warranty forensics, fleet degradation trending, second-life capacity grading, and predictive maintenance. The logging spec tends to get one paragraph in the product requirements document when it should get several pages, because for any deployment lasting more than five years, the diagnostic and forensic value of comprehensive telemetry far exceeds the cost of the flash memory and the firmware to fill it.